By: Ray Barley | Comments (6) | Related: > Reporting Services Development
Problem
I'm trying to create a report that uses a parent-child hierarchy in a dimension of a SQL Server Analysis Services cube. I've done this before where I had a parent-child hierarchy in a SQL Server relational database, but the cube has me completely baffled. Can you provide an example of how to do this?
Solution
Your situation is understandable. Working with a parent-child hierarchy in a relational database is fairly straight forward, while doing the same thing with a dimension in a cube is not.
In this tip I'm going to covering the main points you need to be able to report on a parent-child hierarchy from a relational database then show the one subtlety you need to report on a parent-child dimension hierarchy in a SQL Server Analysis Services cube.
Before we get started I would like to provide an example of what we mean by a parent-child hierarchy in a relational database. Using the AdventureWorksDW database, let's take a look at the dimEmployee table and the FactResellerSales table:
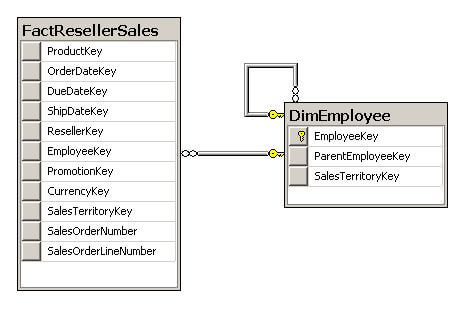
The following are the main points about the above schema diagram:
-
FactResellerSales has a foreign key relationship with DimEmployee.
-
DimEmployee has a primary key of EmployeeKey.
-
DimEmployee also has a foreign key relationship with itself; this is the essence of the parent-child hierarchy. An Employee has a ParentEmployeeKey column which is a foreign key to the EmployeeKey (i.e. the employee's supervisor).
Reporting on a Parent-Child Hierarchy in a Relational Data Source
In this section we will review a sample report based on the AdventureWorksDW database that came with SQL Server 2005. We will use the following query that leverages a recursive common table expression to report on reseller sales using the Employee parent-child hierarchy:
;WITH cte AS (
 SELECT
  EmployeeKey
 , FirstName + ' ' + LastName EmployeeName
 , ParentEmployeeKey
 , 1 EmployeeLevel
 FROM dbo.DimEmployee
 WHERE ParentEmployeeKey IS NULL
 UNION ALL
 SELECT
  c.EmployeeKey
 , c.FirstName + ' ' + c.LastName
 , c.ParentEmployeeKey
 , p.EmployeeLevel + 1
 FROM dbo.DimEmployee c
 JOIN cte p ON p.EmployeeKey = c.ParentEmployeeKey
)
SELECT cte.*, ISNULL(f.SalesAmount, 0) SalesAmount
FROM cte
LEFT JOIN dbo.FactResellerSales f
  ON f.EmployeeKey = cte.EmployeeKey
ORDER BY EmployeeLevel, EmployeeName
A partial result set from the above query is shown below:
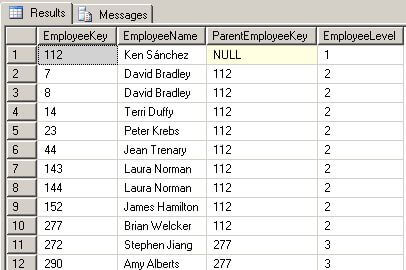
The following are the main points about the result set:
-
Ken Sanchez is at the top of the hierarchy; i.e. his ParentEmployeeKey is null
-
The group of employees with a ParentEmployeeKey of 112 report to Ken
-
The group of employees with a ParentEmployeeKey of 277 report to Brian
-
The EmployeeLevel shows the place of the employee in the hierarchy
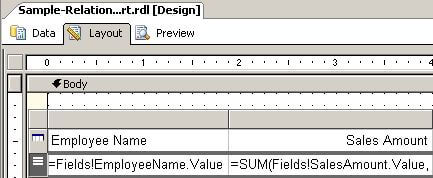
Our sample report report layout is shown below:
Right click on the left-most column of the selected detail line then select Edit Group from the popup menu; you will see the following settings:
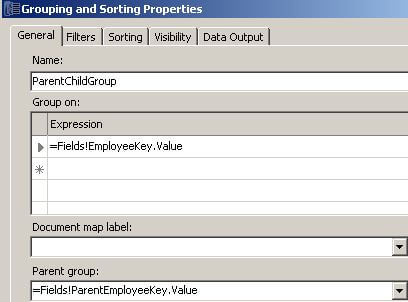
The key point from the above dialog is that we specify the EmployeeKey column as the Group on expression and the ParentEmployeeKey column as the Parent group.
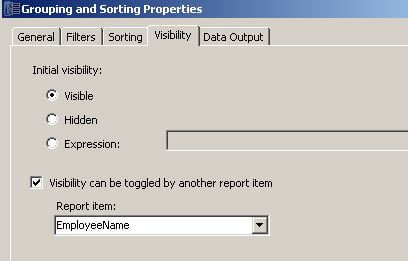
In order to toggle visibility (i.e. enable expand and collapse), the Visibility tab on the Grouping and Sorting Properties dialog has the following settings as shown below:
Referring back to our report layout, the Sales Amount expression is cutoff in the screen shot; the full text of the expression is:
=SUM(Fields!SalesAmount.Value,"ParentChildGroup",Recursive)
The above expression uses the SUM function that accepts three parameters: the expression to aggregate, the scope (i.e. the Name in the Grouping and Sorting Properties General tab), and the value Recursive (i.e. calculate the sum of the row's sales and its child rows' sales).
Our final step to render a simple report is to add a little bit of an indent for our hierarchy. To do that select the Employee Name field in the detail line of the report layout and set its Padding Left property as shown below:
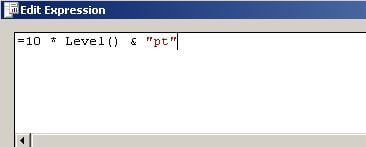
Level() is a built-in function in Reporting Services that returns the level in the hierarchy of the item. As we descend the hierarchy, Level() simply increments by 1. This gives a little more of an indent for each successive level in the hierarchy.
We can now preview the report as shown below:
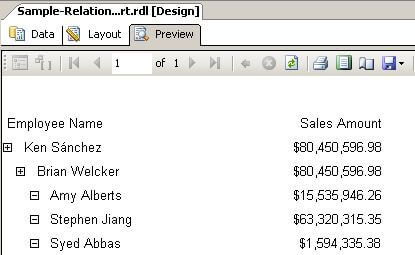
We have covered the main points for creating a report using a parent-child hierarchy in a SQL Server relational database. Let's move on to show how to do it when the parent-child hierarchy is in a dimension in a SQL Server Analysis Services cube.
Reporting on a Parent-Child Hierarchy in a Cube
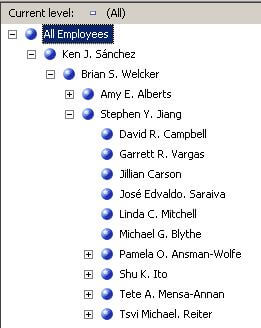
We will leverage the AdventureWorksDW standard cube that came with SQL Server 2005 for our report. The Employee dimension contains the same parent-child hierarchy that we saw in our relational example. If we browse the Employee dimension in the cube we will see the following:
When reporting on a parent-child hierarchy in a dimension of a cube, we need to specify the Group on and Parent group expressions differently than we did in our relational report. The Grouping and Sorting Properties dialog General tab is shown below for our report based on the SSAS cube:
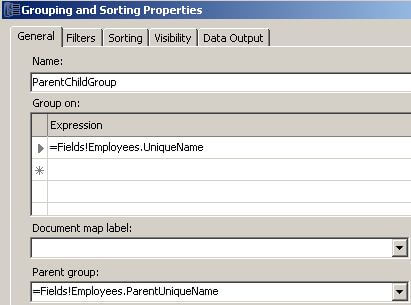
Note that we are using UniqueName and ParentUniqueName instead of EmployeeKey and ParentEmployeeKey as we did in our relational report. UniqueName and ParentUniqueName are both member properties that an SSAS cube makes available to us. This is a very subtle but important difference and I would like to give credit to Robert Bruckner who pointed this out in his blog posting Using Analysis Services Parent-Child Hierarchies in Reports.
You might be wondering how did UniqueName and ParentUniqueName become available to us. The answer is in the generated query in our report dataset as shown below:
SELECT
  NON EMPTY {
    [Measures].[Reseller Sales Amount]
  } ON COLUMNS
, NON EMPTY {
    (DESCENDANTS
      ([Employee].[Employees].[Employee Level 02].ALLMEMBERS) *
       [Employee].[Phone].[Phone].ALLMEMBERS )
}
  DIMENSION PROPERTIES MEMBER_CAPTION
, MEMBER_UNIQUE_NAME
, PARENT_UNIQUE_NAME
, LEVEL_NUMBER ON ROWS
FROM [Adventure Works]
Note that MEMBER_UNIQUE_NAME and PARENT_UNIQUE_NAME are specified in the list of DIMENSION PROPERTIES; this is precisely how those properties are made available.
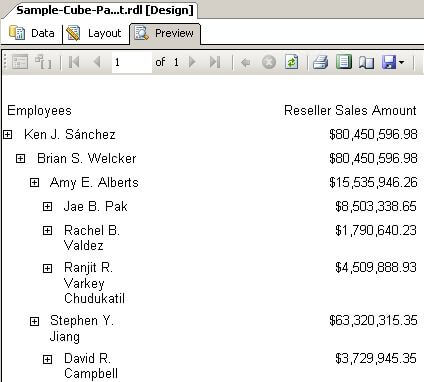
After making the subtle change on the Grouping and Sorting Properties dialog General tab as shown above, we can preview our report that uses the SSAS cube as its data source:
Next Steps
- This tip highlights what we sometimes see in Analysis Services; there is some little subtlety that is required to get the job done.
- You can download the sample reports here and use it as a basis for your own testing and experimentation.
- Check out these related resources:
- Tip Category - Reporting Services
- Tip Category - Analysis Services
- SQL Server Reporting Services Tutorial
- Tip Category - Common Table Expressions (CTE)


About the author
 Ray Barley is a Principal Architect at IT Resource Partners and a MSSQLTips.com BI Expert.
This author pledges the content of this article is based on professional experience and not AI generated.
View all my tips
