By: Hristo Hristov | Updated: 2024-04-22 | Comments (2) | Related: > Python
Problem
I have a dataset representing a time series. There is one index column containing a timestamp and one target column containing a numerical target variable signifying my odometer or the number of kilometers I have driven in total over each period. Using this historical data, how can I predict the kilometers (km) I will accumulate over the following weeks? Knowing how many kilometers I will drive in the future will help me better plan how to service my vehicle.
Solution
We can use a Python library for time series forecasting to predict a target variable over a period. While there are many to choose from, we will focus on the Prophet library today.
Environment
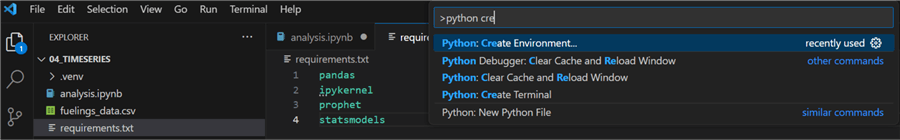
Begin by creating a project folder and opening it using VS code. Then, create
a requirements.txt file
containing four lines: pandas,
ipykernel, prophet, and
statsmodels. Next, hit Ctrl+Shift+P and choose Python: Create Environment.
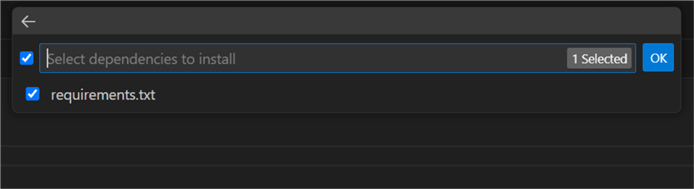
Follow the prompts for creating a local virtual environment. Make sure to check
requirements.txt so the
environment agent will install the required Python packages directly:
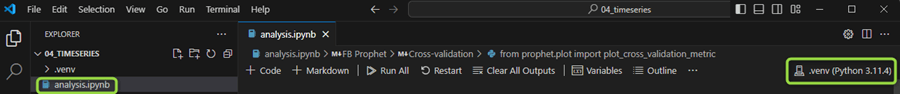
Finally, create a .ipynb file for the experiment. Make sure to select the kernel of the existing project environment:
Dataset Overview
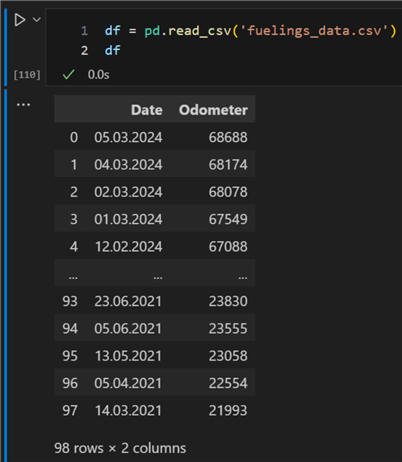
Let us start by checking out the data. I'll use a CSV file containing fueling data for the past three years. The file has two columns:
- Date: date of fueling.
- Odometer: total kilometers at the time of the fueling.
The difference between each consecutive row equals the total distance driven for that period. For example, over the fourth and fifth of March, the distance covered was 68 688 – 68 174 = 514 km. Here is the data preview:
import pandas as pd

df = pd.read_csv('fuelings_data.csv')
df
Transformations
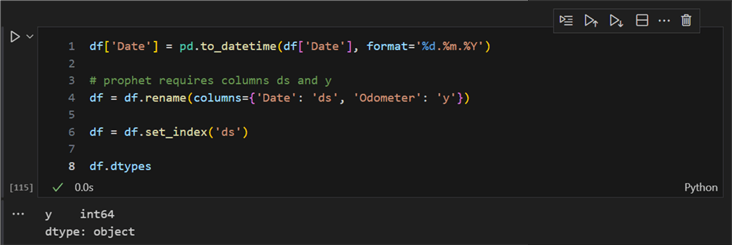
Next, we need to transform these data a bit. We must convert the Date column from the default object type to pandas datetime. Then, we must rename the columns and set the timestamp column as an index column:
df['Date'] = pd.to_datetime(df['Date'], format='%d.%m.%Y')

# prophet requires columns ds and y
df = df.rename(columns={'Date': 'ds', 'Odometer': 'y'})
# but we need an index for resampling
df = df.set_index('ds')
Resampling
The next step is resampling. The intervals in our data set are not equal. We
may have more than one fueling per day or fuelings with more than a week between
them. To build a better model, it is necessary to resample the data into equal frequencies
between the data points. Resampling per se and the intricacies behind it are out
of the scope of this article. However, in this case, I already assessed that I get
a better model with resampling rather than using the data directly. Resampling is
straightforward with the powerful pandas
resample function:
df_resampled = df.resample('W').mean().interpolate(method='linear')
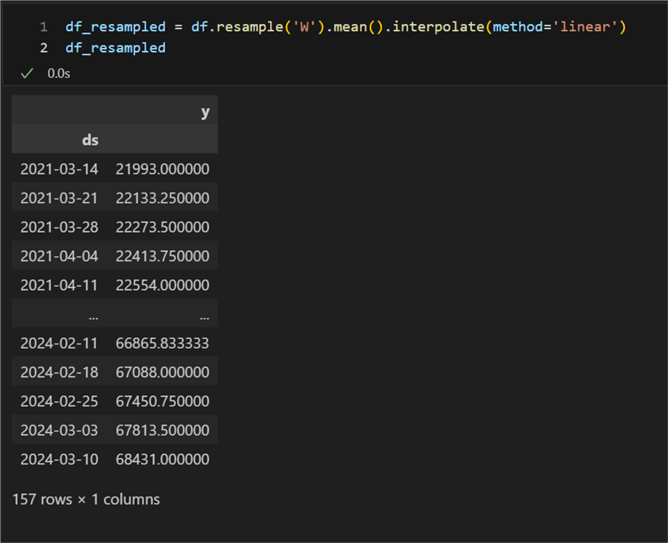
This code:
- Instructs the dataframe to be resampled at equal weekly intervals, stipulated by the 'W'.
- Calls the
mean()function to get the mean over every interval in case there are multiple values per week. - Interpolates using linear interpolation to fill in the missing values when there is not enough data. We will estimate the missing values based on two neighboring temporal points. This is because some of the periods in the original dataset are not equally spaced between each other by a week but by some longer period.
Data Profile
Next, let's grab a quick data profile of the data so far.
df_resampled.describe()
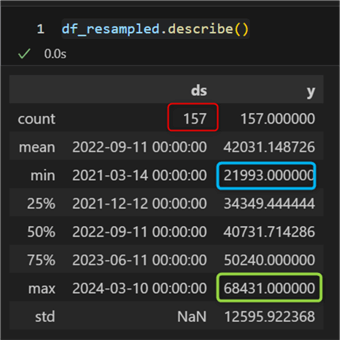
We see:
- In red: the total amount of data points. Notice that, due to resampling, it has increased from 98 to 157.
- In blue: the starting odometer reading.
- In green: the end odometer reading. Notice it has changed from 68 688 to 68 431 km. This change is again due to the resampling and averaging over the existing interval.
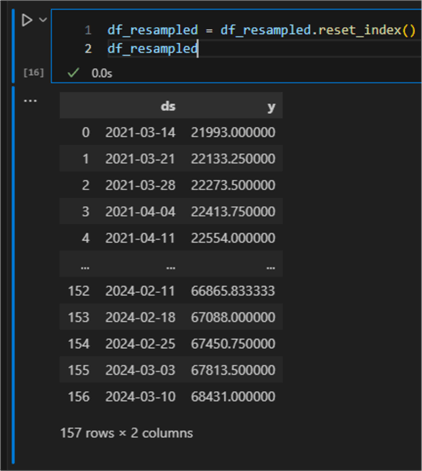
One last point: let us reset the dataframe index. Resampling required a temporal
index; however, the Prophet library expects only two columns named
ds and
y with no dataframe index.
df_resampled = df_resampled.reset_index()
Prediction
Now to the meat and potatoes of this article: making a prediction. Here is the code:
01: from prophet import Prophet
02:
03: m = Prophet()
04: m.fit(df_resampled)
05:
06: future = m.make_future_dataframe(periods=12, freq='W')  # Forecasting for the next 12 weeks
07: forecast = m.predict(future)
08:
09: fig = m.plot(forecast,
10:                  include_legend=True)
Let's break it down:
- 01: Import the Prophet object for the model.
- 03: Make an instance of the Prophet model.
- 04: Fit the model to the data.
- 06: Make a dataframe for the future periods, in this case, 12 weeks.
- 07: Forecast the future for 12 weeks ahead using the model.
- 09: Plot the forecast.
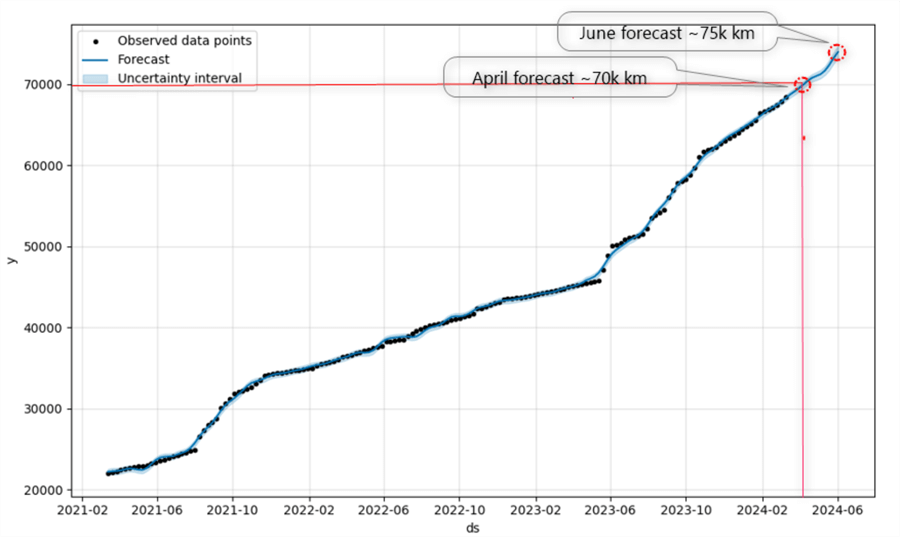
The result is the following line chart plotting the observed data points, the forecast, and the uncertainty interval:
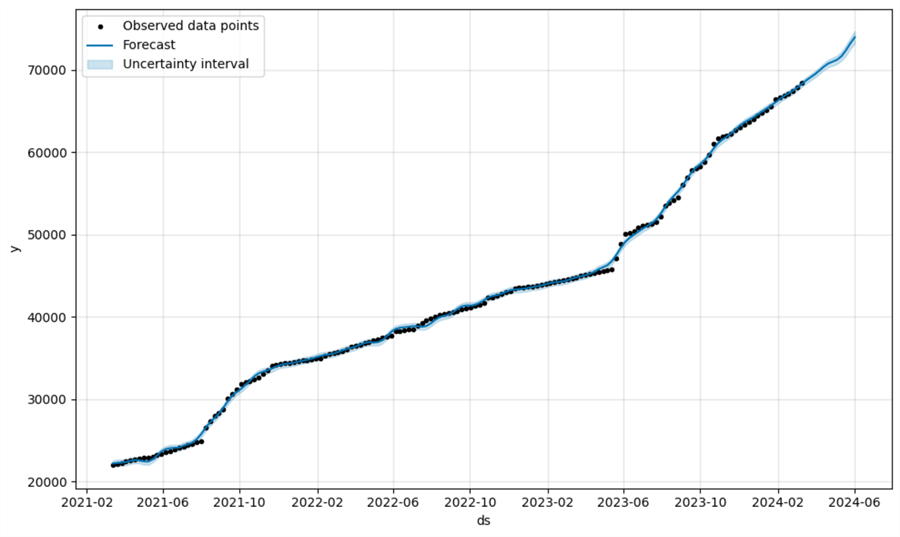
The uncertainty interval seems narrow. Therefore, the model is good, or at least not too bad, considering we are plug-and-playing. However, we should not forget that the data is real-world and high-quality.
Cross Validation
To get a better understanding of the performance of our model, let us cross-validate
it. The cross validation
method will cut the data into chunks that we specified (the period parameter) and
predict a future period (the horizon parameter) for every chunk:
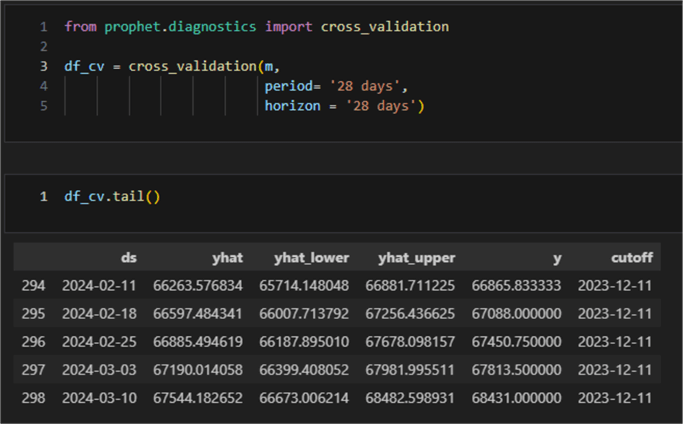
from prophet.diagnostics import cross_validation

df_cv = cross_validation(m,
                         period= '28 days', # 4 weeks
                         horizon = '28 days')
The output of the cross validation is a dataframe containing the true values (y) and the sampled forecast values yhat, y_lower, and y_upper:
Having cross validated the model, we can proceed to computing statistics on the model performance:
from prophet.diagnostics import performance_metrics

df_p = performance_metrics(df_cv)
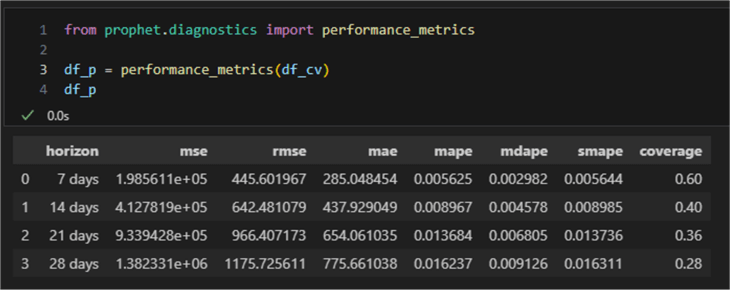
The statistics computed are mean squared error (MSE), root mean squared error (RMSE), mean absolute error (MAE), mean absolute percent error (MAPE), median absolute percent error (MDAPE), and coverage of the yhat_lower and yhat_upper estimates. We are interested in MAE (unit is kilometers) and MAPE (unit is a percentage). We see that for a short forecast period (1-2 weeks), the error percentage is below 1; up to a month (4 weeks or 28 days), it is about 1.6%. These values are valid in the context of this model only. They give an accurate idea of what odometer readings to expect in the coming periods.
Plotting the Evaluation Metrics
Finally, we are ready to plot the evaluation results of the model to make sense of everything so far.
from prophet.plot import plot_cross_validation_metric
fig = plot_cross_validation_metric(df_cv, metric='mape', rolling_window=0.1)
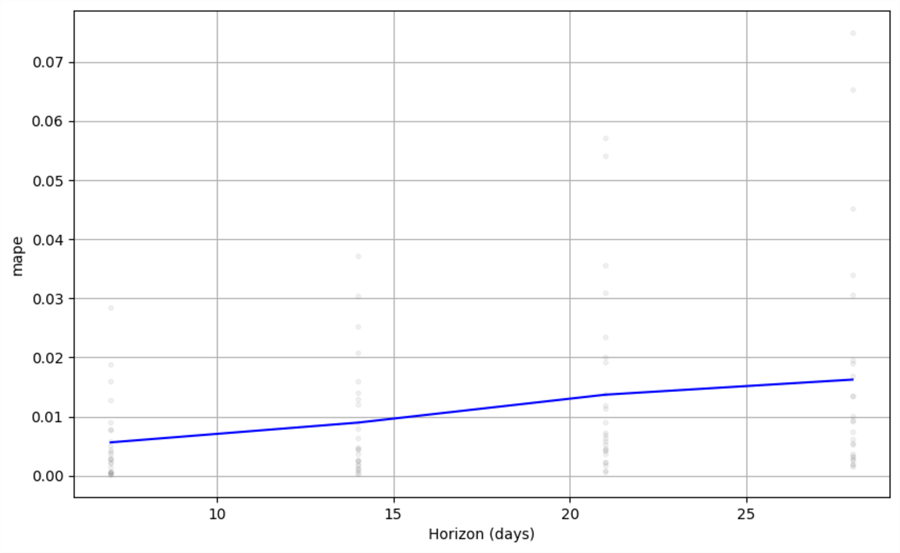
As pointed out already, we see that for up to two weeks ahead, errors of up to 1% are common. For predictions further in the future, the error may approach 1.6–1.7%.
Conclusion
As seen in the prediction plot, two points of interest stand out. Sometime in the beginning of April, the odometer will reach the 70 000 km mark. Assuming the next oils service is due at 75,000 km, it is safe to assume that I should have the vehicle serviced in June unless a drastic change in driving habits occurs.
Next Steps


About the author
 Hristo Hristov is a Data Scientist and Power Platform engineer with more than 12 years of experience. Between 2009 and 2016 he was a web engineering consultant working on projects for local and international clients. Since 2017, he has been working for Atlas Copco Airpower in Flanders, Belgium where he has tackled successfully multiple end-to-end digital transformation challenges. His focus is delivering advanced solutions in the analytics domain with predominantly Azure cloud technologies and Python. Hristo's real passion is predictive analytics and statistical analysis. He holds a masters degree in Data Science and multiple Microsoft certifications covering SQL Server, Power BI, Azure Data Factory and related technologies.
This author pledges the content of this article is based on professional experience and not AI generated.
View all my tips
Article Last Updated: 2024-04-22