SQL Server Reporting Services Range Charts

By:   |   Comments (12)   |   Related: > Reporting Services Charts


Problem

What exactly is a SQL Server Reporting Services Range Chart and how do I implement a range chart?

Solution

A range chart is a powerful way to show two discrete values related to a single category point while at the same time showing the variance between those two values. Some data sources are well suited to showing how data values vary within a single category value. A continuous range such as a date often makes up the category; of course, several data sources come to mind when think about potential uses of range charts. One example of its use would be a chart to display the high and low temperature for a given data range; furthermore, you could add a series for locations or zip codes to such a chart. Other uses of range charts include 1) showing the daily range of stock market prices over the course of day, month, or year 2) show the high (peak) and low CPU or memory usage of a server over an hour, day, month, or year 3) showing a river's or reservoir's high and low levels over the course of a day, week, month, or year. Finally, one of the neat uses for a range chart is to display a Gantt chart.

We will use the Adventure Works databases as the basis for our SSRS report examples. The 2014 versions of the regular and data warehouse databases are available on Codeplex at https://msftdbprodsamples.codeplex.com/releases/view/125550. Once you download and install the SQL Server databases, we will subsequently use SQL Server Data Tools for Business Intelligence (SSDT-BI) for Visual Studio 2013 to develop reports. You can download SSDT-BI from: http://www.microsoft.com/en-us/download/details.aspx?id=42313.

Utilizing SSRS Range Charts

When you design a range chart you need to be aware of a few caveats. First, if there are problems with your data in that your high value is lower than your low value, SSRS will still plot the range in its flipped form. Secondly, if you only include one value in the data set, only a single line will be shown; basically it becomes a line chart. Finally, although data markers can be turned on, they do not display correctly.

You have four choices for range chart types: 1) range chart 2) column range chart 3) bar range chart 4) smooth range chart.

Let us get started with an example; we will use the high and low temperatures for two cities in the US, Westerville, OH and Kennesaw, GA. A snippet of the dataset is displayed below.

Dataset for weather

Next, we will drag the chart object onto the report design grid as noted next. For this example, we will develop a regular range chart as shown in the second screen print.

drag chart to grid

Select Range Chart

Once the Range Chart has been added, we need to add three data point items, like most charts. First, we will add the data values to appear on the chart. Second, we will select a category, and third, select a series data item (this item is optional).

Steps to add

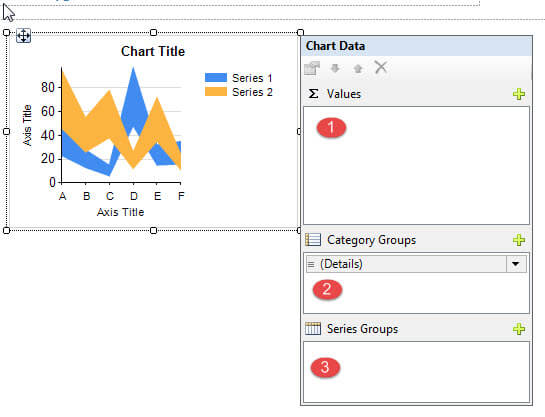
In step 1, we add the high value first as shown in the first screen print below. You will notice after adding the high value that a second value line item shows up with a designation of Low. This setup can be confusing as some may assume the low value was also selected.

Add Value

Adjust Low Value

However, you actually need to select the low value to be included in the range, LowTemp for our example.

Change Low to Sum

Finally, we add the category of Date and the select Location for the series.

Add categpru and series

To finish our chart, we add / adjust the following items as shown in the below screen print:

  1. Add a Chart Title
  2. Add Axis Title for Temperature
  3. Format the Horizontal Axis to display the dates appropriately. We also adjust the interval to 1in order to show all dates within our dataset.
  4. We move the series legend to the bottom of the chart
  5. Finally, the chart size is increased to allow for a good view of the chart.
format chart

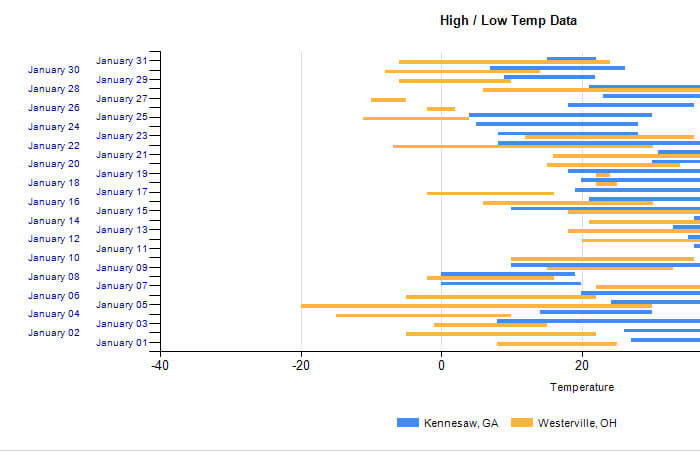
The final result of our range chart is displayed next.

Final chart

In the above screen print it is easy to see why the range chart is a good way to see extremes. Two items should be noted. First, as noted with #1 in the above screen print, the January 10th high and low values for Kennesaw, GA are inverted ( the high is lower than then low), but SSRS still displays the values with what I call a squeeze effect (like a hard candy wrapper). Notice how the range goes to zero on either side of the January 10th values. Second, when using multiple series, it is possible, as shown in #2 above, to have one range "cover over" a second range. A good alternative, shown below, is to convert this particular chart to a column chart; another alternative would be a bar chart, as illustrated in the second screen print below, although it is a bit busy.

column range chart

bar chart

Gantt Chart... too!

Following a similar pattern to the bar range chart, we could actually create a Gantt chart using a bar range chart. Using a simple table with project and task info, as displayed below, we can demonstrate one way to make a Gantt Chart.

Project Table

The below SQL code does several things including finding the minimum start date of the project and then determining how many days are between the first date in the SQL Server calendar (12-30-1899) and the project start date. Next the query simply retrieves the project, task, start date, end date, and duration. Next, we calculate the start date of each task as compared to the start date of the project and then add the days since 12-30-1899. We do the same calculation for the end date. These figures will be what gets plotted on the Gantt chart. Finally, the query returns the project start date value and the number of days between the start date and 12-30-1899. We will use this last value for our horizontal axis "begin value" (hint: we do not start at 0, but at the number which relates to the project start date or 42154 in the query results screen print). For the range chart we need to have numeric equivalent values, not dates; by getting the days since the beginning of the SQL Calendar, we can quickly get a high and low values for each of days, all in reference to the beginning of the SQL Server calendar. Secondly, these numeric equivalents can easily be tied back to the true date.

DECLARE @PROJECTSTARTDATE DATE 
DECLARE @PROJECTSTARTDATEINT AS INT

SELECT @PROJECTSTARTDATE = MIN(STARTDATE),
@PROJECTSTARTDATEINT = DATEDIFF(DAY, 0, MIN(STARTDATE))
FROM ProjectListGantt

SELECT Project
,Task
,StartDate
,EndDate
,DATEDIFF(DAY, StartDate, EndDate) AS Duration
,DATEDIFF(DAY, @PROJECTSTARTDATE, StartDate) + @PROJECTSTARTDATEINT AS StartPoint
,DATEDIFF(DAY, @PROJECTSTARTDATE, StartDate) + DATEDIFF(DAY, StartDate, EndDate) + @PROJECTSTARTDATEINT AS EndPoint
,@PROJECTSTARTDATE AS ProjectStartDate
,@PROJECTSTARTDATEINT
FROM ProjectListGantt

This query provides the following results. You can quickly see that our start and end points are converted to a numeric value as compared back to the beginning of the SQL Server Calendar.

Gantt Query Results

Now, we create a Bar Range chart using the EndPoint field for the high value and the StartPoint field for the low value. Furthermore, we add Task to the Category Group (we do not use a series for this example).

3521_Gantt Chart Setup

The next step is to make several adjustments to the horizontal axis properties as illustrated next. For the axis properties, the "Always include zero" check box is unchecked as we do not want to include day 0 (aka 12/31/1899). Next we set the Minimum value to the Project Start Date numeric equivalent or 42154. Since the dataset includes multiple rows, we use the first function to grab the first rows value. Next we adjust the Interval to 1 and the Interval type to Weeks (this value could be days or months of course); this allows us to have the horizontal axis to show weekly dates beginning with the project start date.

Horz Axis

The last step for this simple example is to adjust fill color for each task. Without making this change, all the bars will have the same color. Of course there are various ways to complete this task, however, in the below example, I simply used the Switch function to hard code the fill color based on the task name.

change fill color

The last steps are to add axis and chart titles and increase the size of the chart. The final result is displayed below.

Gantt Chart Final

Conclusion

Range charts provide an excellent method to display both the high and low values for a category of data points. Often the category is over a date range, such as the high and low temperature during a group of days in a month. However other categories can exist, such as tasks on a Gantt chart. SSRS provides us with 4 different range charts: range, smooth range, bar, and column. Each type has its own advantages and disadvantages, but all types require a high and low value. Furthermore, although you can add data markers to your range chart, SSRS does not support their use. Range charts provide another graphical tool in your SSRS tool chest.

Next Steps


sql server categories

sql server webinars

subscribe to mssqltips

sql server tutorials

sql server white papers

next tip


About the author
MSSQLTips author Scott Murray Scott Murray has a passion for crafting BI Solutions with SharePoint, SSAS, OLAP and SSRS.

This author pledges the content of this article is based on professional experience and not AI generated.

View all my tips


Comments For This Article


Thursday, January 12, 2017 - 7:17:12 PM - Scott Murray Back To Top (45246)

 You should be able to change the color based on the data value.... you will need to though come up with the ranges for the color.


Thursday, January 12, 2017 - 2:34:00 PM - Torben Hansen Back To Top (45242)

 Gantt Chart :
is it possible, to have the the color to change according to the value,
e.g. when "QA Report" are before 8/9-2015 is blue, and after that date, the bar is red


Thursday, March 3, 2016 - 1:37:54 PM - Zolotoy Back To Top (40856)

 I am experimenting with striplines in order to highlight an area on a Line chart. I have a horizontal line with a custom height. But it would go across the whole x axis. Thats' is not what I want. I want it to start at a given value of the category (X) and continue to another given x point. Any idea?


Thank you.


Thursday, April 9, 2015 - 8:38:20 AM - Lyna Back To Top (36875)

Thank you Scott.

I started a new chart with just trip start and end times, and left off the time clocked in and out for the day which is a different item.  The new chart only lists the 0-24 hr times horizontally once and puts the info on by date on the vertical axis correctly.  It is having issues when a trip runs over into the next day - the charting backwards issue due to the end time being smaller than the start time. But the rest of the info looks good.  The clocked in and out info was causing the horizontal 0-24 hrs to start over on the chart.  I don't know enough to know why but when it's removed the other info works.

Thank you for all the help.  I really appreciate it.

Lyna


Wednesday, April 8, 2015 - 6:10:16 PM - Scott Murray Back To Top (36867)

Sorry... no way to post a picture..a forced range "Gannt chart" is probably not the best tool

You do need to convert all your times to a 24 hour scale.... time only.  You need to figure out how you want to covert a 24 day into minutes or decimals. 

Then you categories would be the person, date, line type (When the person worked and when they were away on trips during their work day. )... So you need at least two rows of data for each day a person is recorded.. one for when they are away and one for when they worked. Of course you could have more.


Wednesday, April 8, 2015 - 3:15:24 PM - Lyna Back To Top (36864)

I'm sorry I'm afraid my description is as clear as mud.

It might be easier to use your gantt chart for the example.  If you change your ProjectStartDate and EndDate to DateTime instead of just date and listed when each task was worked on each day with the same task being worked at different times on many different days so there are many rows for each task instead of just one row for each task..  Change the Project to include two different projects.  If you wanted the times for the horizontal axis 0-24 hrs listed only once and the dates as the vertical axis with each day being a new "row" on the gantt chart and the Series to be  the Tasks (each task with it's own color) how do you make the chart see the times as 0-24 and not the date+0-24 for the horizontal axis and as just the date for the vertical axis?  Also what would be in the category Groups and Series Groups for the chart. I think I may be confused about the CategoryGroups.

In the case of our chart there are two things on one chart.  When the person worked and when they were away on trips during their work day. The Start Time and End Time are times when the person clocked in and out for the day. They should be one long bar on the chart for each day worked.

The departure times are times when they were away on a trip.  They are the StartTimeZ date times. They should be another bar on the chart. Much shorter than the start and end time bar and there may be several trips on the same day.

The start time ideally should never match the departure time as they have to have time to prepare for the trip.

For example on 3/10 there should be one horizontal bar from 10:34AM to 11PM for when the person clocked in for the day and out for the day.  There should be one horizontal bar from 11:21 to 11:50 and a third horizontal bar from 12:50PM to 14:38PM all on 3/10.   For 3/11 there should be nothing.  For 3/12 there should be one horizontal bar for 2:00PM to 9PM and a 2nd horizontal bar from 15:28 -17:09. Etc.  All the bars are coming up correctly on the correct dates with the correct times but the times are repeating themselves on the horizontal axis which causes the bars to move over for each new day instead of all stacking neatly on one 0-24 hour wide period for the month. The good news is they still move up the vertical axis into the correct date.  I'm sorry for the muddy description.  Please, let me know if there's a way to post a picture of the chart as it is much clearer.

Thanks,

Lyna


Wednesday, April 8, 2015 - 1:07:10 PM - Scott Murray Back To Top (36862)

Sorry.. I am not following your categories as your start and end do not match your departures times. Also not sure why you have the start time (really date time) and depart time as categories.  Your start time should be the low value and the end time the high value.


Wednesday, April 8, 2015 - 12:57:07 PM - Lyna Back To Top (36861)


Display Name
Duty Start Date Zulu
Departure Date Zulu
Start Time Z
End Time Z
(Time Out) Departure Time & Date Z
Time Out
Time In
Operation Type
 
Barmore, Ryan
3/5/2015
3/5/2015
3/5/2015 5:00:00 PM
3/6/2015 2:00:00 AM
3/5/2015 9:04 PM
21:04
23:58
FAR 91K
 
3/6/2015
3/6/2015
3/6/2015 12:30:00 PM
3/7/2015 12:00:00 AM
3/6/2015 12:14 AM
0:14
00:41
FAR 91
 
3/6/2015
3/6/2015 12:30:00 PM
3/7/2015 12:00:00 AM
3/6/2015 1:55 PM
13:55
16:10
FAR 135
 
3/6/2015
3/6/2015 12:30:00 PM
3/7/2015 12:00:00 AM
3/6/2015 7:16 PM
19:16
21:12
FAR 135
 
3/10/2015
3/10/2015
3/10/2015 10:34:00 AM
3/10/2015 11:00:00 PM
3/10/2015 11:21 AM
11:21
11:50
FAR 91
 
3/10/2015
3/10/2015 10:34:00 AM
3/10/2015 11:00:00 PM
3/10/2015 12:50 PM
12:50
14:38
FAR 91K
 
3/12/2015
 
 
StartTimeZValues
StartTimeZ is High
EndTimeZ is Low
 
TimeOutValues
TimeOut is High
Time In is Low
 
CategoryGroups
TimeOut
StartTimeZ
 
SeriesGroup
Operation Type
 
 
3/12/2015
3/12/2015 2:00:00 PM
3/12/2015 9:00:00 PM
3/12/2015 3:28 PM
15:28
17:09
FAR 91K


This is for the chart which pulls everything correctly as far as the horizontal axis and the dates go but starts the hours over again on the vertical axis for each date.  If we need to do just one category group per chart if we can get StartTimeZ to work that would be great.  It would use StartTimeZ and EndTimeZ for the start and end times.

Thanks,
Lyna


Wednesday, April 8, 2015 - 10:53:23 AM - Scott Murray Back To Top (36859)

You need a single start and end point per row.... really need to see what data is being sent.  The hours need to become your start and end times for each row.


Wednesday, April 8, 2015 - 10:02:22 AM - Lyna Back To Top (36858)

I think that is where I am having issues.

I tired converting the time date to just time but then I lost the vertical axis which was being fed by the date part so nothing shows up but it does solve the problem with the vertical axis starting over for each day. 

Then I tried still using the datetime to pull the vertical axis and just the time for the high low but the chart appears to assign things to the dates at random for example I have info showing on the chart for a day that should not have any info and I still get the 24 hour vertical axis repeat issue.

Still have not figured out how to post the chart here but here are the Values, Categorgy Groups and Series Groups for all three chart attempts.  Hopefully, it will be obvious where I am going wrong from the Values.

Version which gets vertical axis date but starts hours over for each day on horizontal axis - TimeOut and Start and EndTime are  timedate -

  1. Values - TimeOut,  High - Fields!TimeOut.Value,  Low - Fields!TimeIn.Value,  XValue [TimeOut],  2nd item -StartTimeZ, High - Fields!StartTimeZ.Value, Low - Fields!EndTimeZ.Value, XValue  [StartTimeZ]
  2. CategoryGroups -  TimeOut,   StartTimeZ
  3. SeriesGroups - OperationType

Version which appears to assign times to random dates on the vertical axis and still repeats the 0-24 multiple times for the horizontal axis - TimeOut and StartTimeZ are timedate, TimeOnlyTimeOut, TimeOnflyTimeIn, OnlyTimeStartTimeZ, and OnlyTimeEndTimeZ are just the time.

  1. Values -TimeOut, High -Fields!TimeOnlyTimeOut.Value, Low - Fields!TimeOnlyTimeIn.Value, XValue [TimeOut], 2nd item - StartTimeZ, High - Fields!OnlyTimeStartTimeZ.Value, Low - Fields!OnlyTimeEndTimeZ.Value, XValue[StartTimeZ]
  2. CategoryGroups - TimeOut,  StartTimeZ
  3. SeriesGroups - OperationType

Version which comes up blank due to no vertical axis data but does not repeat the 0-24 hrs multiple times for the horizontal axis

  1.  Values - TimeOnlyTimeOutT, High -Fields!TimeOnlyTimeOutT.Value, Low - Fields!TimeOnlyTimeInT.Value, 2nd item - OnlyTimeStartTimeZ, High - Fields!OnlyTimeStartTimeZ.Value, Low - Fields!OnlyTimeEndTimeZ.Value
  2. CategoryGroups - TimeOnlyTimeOutT,  OnlyTimeStartTimeZ
  3. Series Groups - OperationType

Basically the chart is supposed to be showing the times each day when a pilot started and ended the day think clocked in and clocked out and the times for any flights which he flew each day- will usually be multiple flights.  It is one chart per pilot per month so there should be 30 - 31 vertical "rows" days with 0-2400 hours for the day on the horizontal axis only once.  The Operation Type is assigned to each flight and the colors are determined by the operational type - there are 4 colors. Ideally all the flights for the same day would be listed on just one row on the chart but DrawSideBySide Does not appear to be working a problem which I need to figure out if it does not fix its self after the hours quit repeating themselves for each day on the horizontal axis.

Thank you for the help. 

Lyna


Tuesday, April 7, 2015 - 8:05:45 PM - Scott Back To Top (36852)

Have you tried splitting out the time from the date?


Tuesday, April 7, 2015 - 5:01:59 PM - Lyna Back To Top (36850)

Hello Scott,

Thank you for the tips.

They were very useful. 

Is it possible to create a gantt - range bar chart with the date as the horizontal axis and the time as the vertical axis?

My data is in time date format and I am trying to get the time to be 0-2400 only once, currently the date works great for the horizontal axis but the time starts over for each day on the vertical axis making the chart really wide. 

I have SQL2008 R2.

I am trying to figure out how to post a shot of the chart and the chart data info here but have not succeeded yet.

In this case a picture is worth a thousand words.

I am new to SQL but am learning. Any advice is greatly appreciated.

Thanks,

Lyna


get free sql tips
agree to terms