By: Tibor Nagy
Overview
In this section we will use the AdventureWorksDW database to demonstrate the parts of a Graphical Query Plan. This sample DB can be downloaded from the Codeplex site.
Explanation
We will run two basic queries in a batch and analyze the Graphical Execution Plan.
Enter these queries in SQL Server Management Studio in a new query window.
SELECT ProductKey,ProductSubcategoryKey
FROM AdventureWorksDW..DimProduct
WHERE ProductKey<100

SELECT ProductKey,ProductSubcategoryKey
FROM AdventureWorksDW..DimProduct
WHERE Color<>'Silver'
First let's see the Estimated Query Plan. Turn on this option using CTRL + L and then execute the query. (note: the execute will only create the plan it does not actually run the query)

Now let's Include the Actual Execution Plan by pressing CTRL + M in the query window and then execute the query. (note: this will actually run the query and return data)
As you can see the Estimated and Actual are almost identical except that we have an additional Missing Index hint in the Estimated Query Plan. So you can see that you can get a pretty good representation of the query plan without having to actually execute the query.
Analysis
Now we will examine all the elements of the Actual Query Plan.
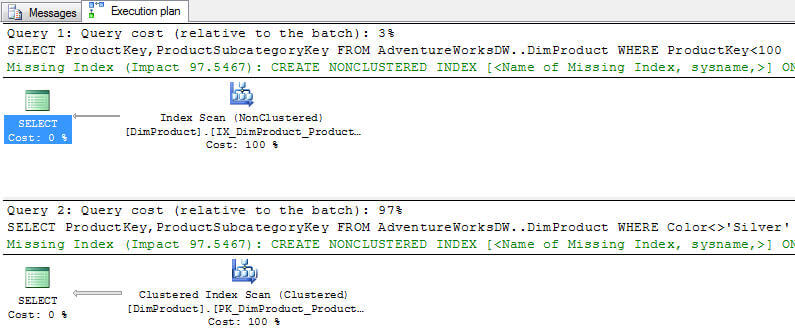
As you can see, both of the queries in the batch were included in the query plan. The queries are numbered and you can check their relative cost compared to the whole cost of the entire batch:
Under the query headline you can see the query that was run:
Also for Query 2, the query optimizer finds that the query can be run more efficiently using a new index which it shows the recommendation in green. This hint also includes the potential impact on the execution cost and the SQL statement if the index existed.
Each box in the Query Plan represents a physical operation that was created by the query parser and executed by the database engine. The boxes are connected by bars that show the data flow. They should be read right to left so the arrows point to the left. The fatter bars between operations indicate that more rows are passed between the operators.
The following items are highlighted on the below screenshot:
1. An operator in the query plan.
2. A relatively fatter bar representing the main data flow.
3. The percentage of resources used to execute the operator. This value is relative to the whole query execution cost.
Operator Summary
Let's take a closer look at the properties of the Graphical Query Plan operators. They can be displayed in ToolTips. You simply scroll to an operator icon, point your mouse on it and a list of operator properties will be displayed as shown below. The below image is the ToolTip for the Clustered Index Scan operation.
The list of the properties is as follows:
- Physical Operation: the physical operation performed.
- Logical Operation: the logical operation that is executed by the physical operation.
- Actual Number of Rows: the actual number of rows returned by the operator.
- Estimated I/O Cost: this value shows I/O usage. However, it is a relative value so you can only see how it compares to other operator's value in the Query Plan. The larger the number the more resources are used.
- Estimated CPU Cost: this value shows CPU usage. It is also a relative value so you can see only if it is larger then any other operator's in the Query Plan.
- Number of Executions: how many times the operation was performed to fulfill the query.
- Estimated Number of Executions: how many times the operation should be performed to fulfill the query.
- Estimated Operator Cost: you can see this percentage under the operator icon. This is the total amount of the I/O and CPU estimated costs therefore it is also a relative value.
- Estimated Subtree Cost: this is the total cost of this operator and all preceding operators.
- Estimated Number of Rows: the estimated number of rows returned by the query. This value is based on the statistics.
- Estimated Row Size: the estimated length of rows returned by the query. This value is also based on the statistics.
- Actual Rebinds: these values show how many times the Init() method was called.
- Actual Rewinds: these values show how many times the Init() method was called.
- Ordered: this is a Boolean value showing whether the rows are ordered in the operation.
- NodeID: every operator in the Execution Plan has a unique NodeID. This is an ordinal value. If they are zero then the Actual Number of Rows and the Estimated Number of Rows are comparable.
- Cached plan size: this is the amount of memory reserved for this Query Plan in the Procedure cache. This property is displayed only at the Result operator.
What should we look for?
During query optimization we should look for the most resource intensive and suboptimal operations. The following items require deeper investigation: higher percentages, the fat bars, scans, etc...
In this simple example, Query 2 used 97% of the resources and the Index Scan for Query 2 was 100% of that. So based on this query plan you should focus on this operation. Also, SQL Server gave us a hint to create a new index which would greatly improve the performance of this query.
Additional Information
- How to read SQL Server graphical query execution plans article on MSSQLTips
