By: Ben Snaidero
Overview
In this topic we will show you a couple of different ways you can use SQL Profiler to save your trace data to a database table so it can be queried at a later date for analysis.
Explanation
Configure SQL Profiler to save all Data to a SQL Server Table
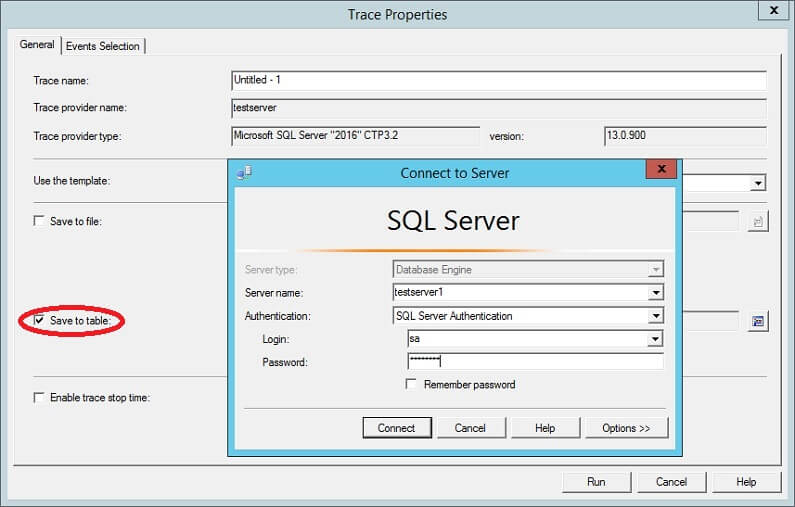
The first way to save your SQL trace data to a table is by configuring the data to be saved to a table when you initially setup the trace. Looking at the screenshot below of the "General" tab of the Trace properties screen you can see there is a checkbox circled in red that gives you the option to save your data to a table. Once you click this checkbox you will be presented with the "Connect to Server" dialog, also shown below, which will let you connect to the SQL Server instance you will use to save this data.
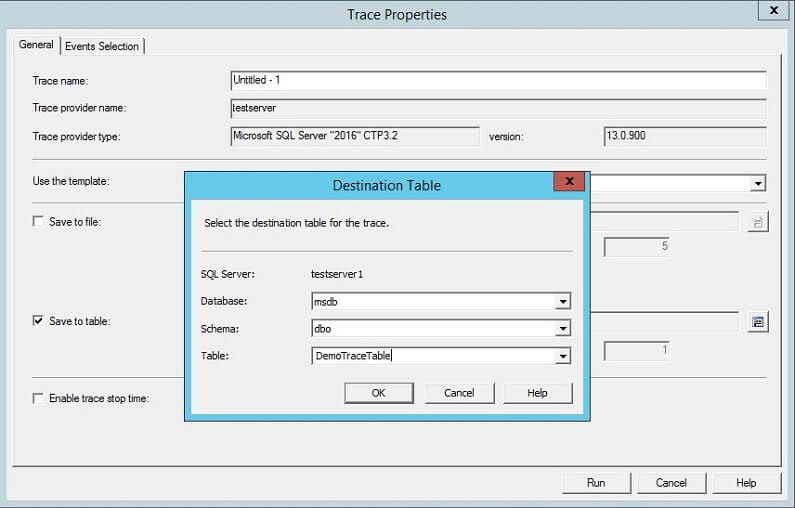
After you successfully connect to the instance you will be presented with another dialog box, "Destination Table", shown below, that will allow you to select the database and table on this instance to store the data.
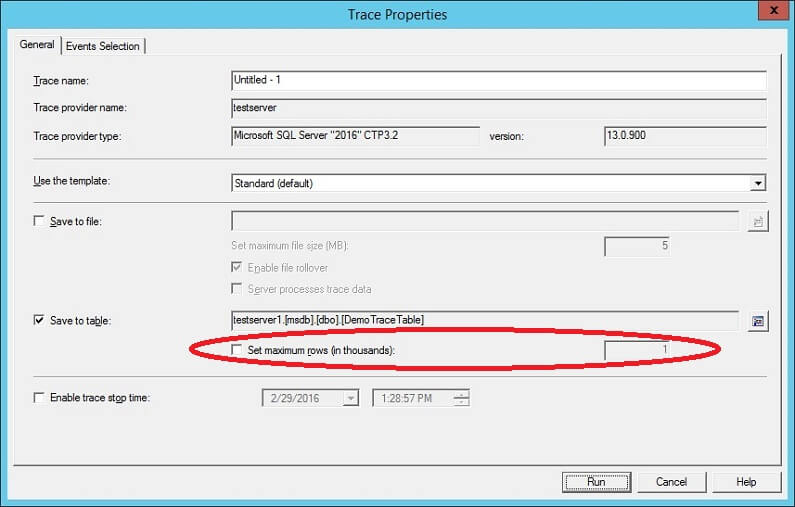
Once that has been completed your screen should look like the screenshot below. Now you can click "Run" button to start your trace and your trace data will be presented in the usual output window as well as being saved to the table you defined. Also note below, circled in red is an option that allows you to limit the size of this table. I normally don't use this option as I don't want to lose any data and if you hit this limit the trace will stop writing to the table. Another reason you shouldn't need this option is your trace data should be saved to a table that is in some sort of DBA management database not an application database that you would have issues with should you fill a disk drive unintentionally.
Save a SQL Server Profiler Session to a Table Once Completed
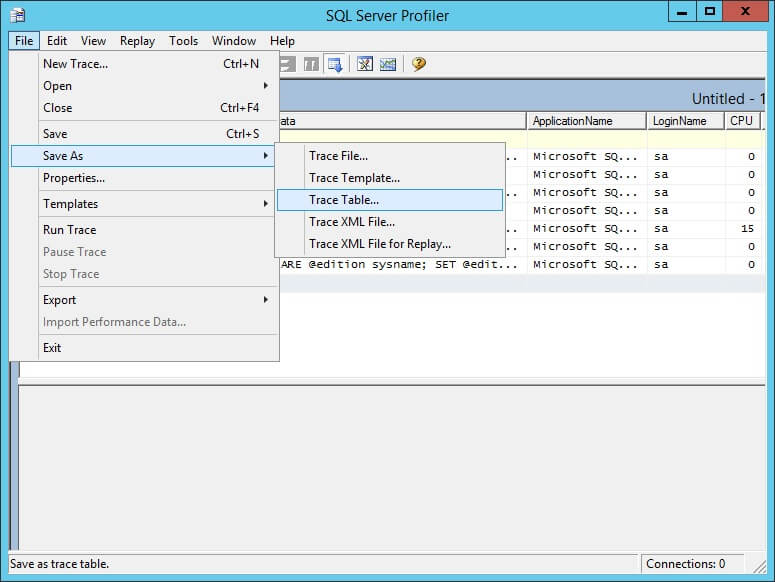
The other option for saving your SQL trace data to a table is by saving it once your trace session is complete, that is after you click the stop button. Once your trace has been stopped you can save the data to a table from the "File-Save As-Trace Table" menu item shown below. After selecting this you will be presented with the same "Connect" and "Destination Table" dialog boxes shown above. Depending on the amount of data in your trace it may take some time to save it to the table. You can check the progress in the status bar at the bottom of the output window.
Querying Data Saved to a Trace Table
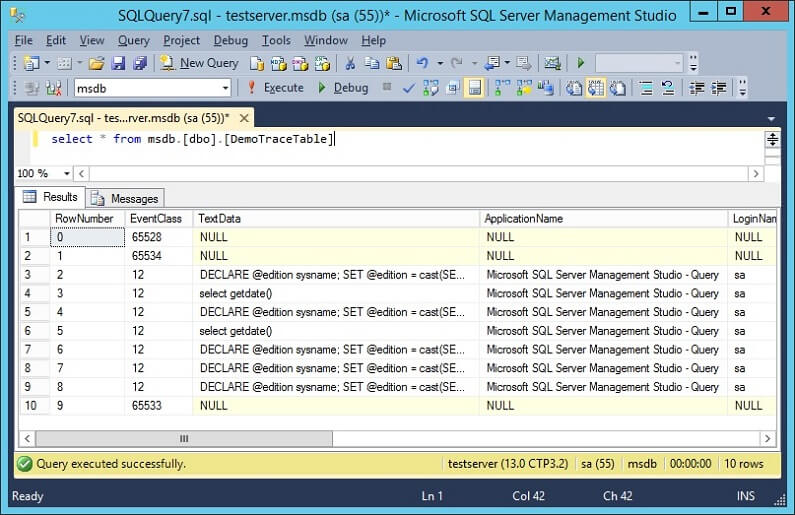
With our data saved in a table we can query it just like we would query any other table using any of our standard SQL Server query tools. Below is a screenshot showing the output of a really short, simple SQL trace session using SSMS.
Please note that the unit of measure for the duration column will change from milliseconds to microseconds when the data is saved to a table. As an example, the Profiler GUI will show 62 and the table will store 62000. Be sure to adjust your queries correctly, to have the values match Profiler, divide the duration stored in the table by 1000.
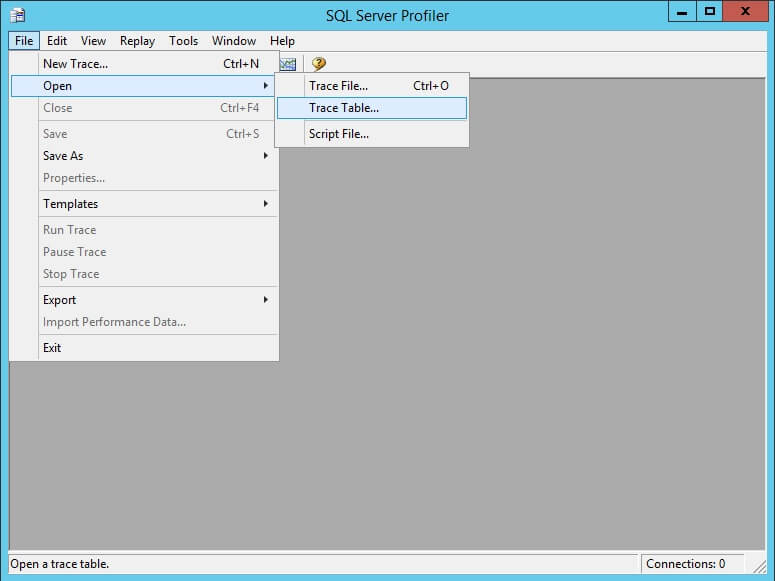
For those of you that prefer the SQL Profiler output window for viewing trace data you can also start SQL Profiler and open the trace table using the "File-Open-Trace Table" menu item as shown below. This will open your data in a new output window and from here you can filter or search on whatever criteria suits your needs. You can even save the filtered data to a new trace table or file from here as well. Sometimes it's handy to use this feature to save a new trace file after filtering on a single SPID.