By: Siddharth Mehta
Overview
In order to test the accuracy of model prediction, the data mining editor has a view called the Mining Accuracy Chart in the Mining Accuracy Chart view. There are four tabs in this view to configure and test the prediction of the data mining model - Input Selection, Lift Chart, Classification Matrix, and Cross Validation.
Explanation
Click on the Mining Accuracy Chart to open.
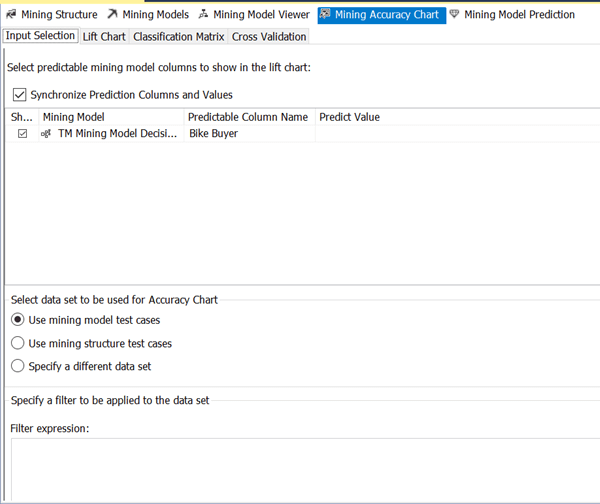
1) The Input Selection pane enables you to select certain predictable attributes and corresponding values to use in Lift Chart comparison. You can choose 0 or 1 for the Bike Buyer attribute to analyze the accuracy for specific values. The lower pane provides different options to select the dataset for test cases which are represented in the Lift Chart.
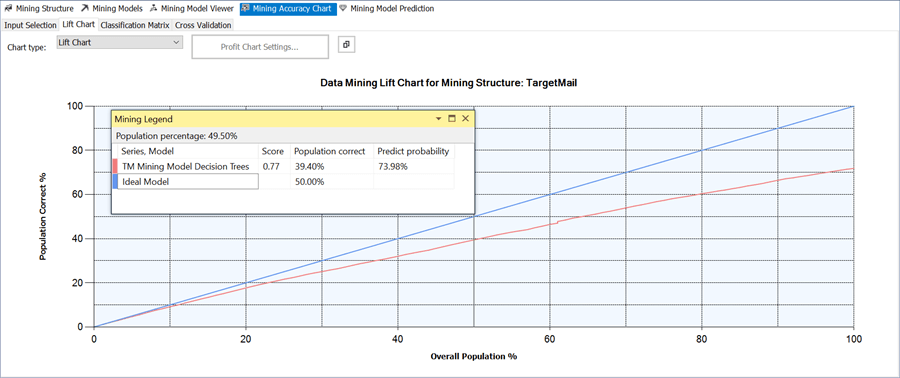
2) The Data Mining model predicts the bike buyer attribute for every row in the input table. After predicting the values for all the input rows, the results are ordered based on the predict probability. Then the predicted results are compared with the original values to calculate the prediction correctness percentage, and they are plotted on a graph called Lift Chart.
3) To analyze the validity of the model graphically, select the Lift Chart tab. The X-axis shows the percentage of data set used for prediction, and the Y-axis shows the percentage of prediction correctness. A perfect model would have 100% correctness which is represented by a blue line in the graph. The accuracy of the model prediction is represented by the red-line. You can use the mining model to predict the bike buyer value for each customer. If the predicted value is the same as the actual value in the validation data set you have chosen, the model has predicted the value correctly.
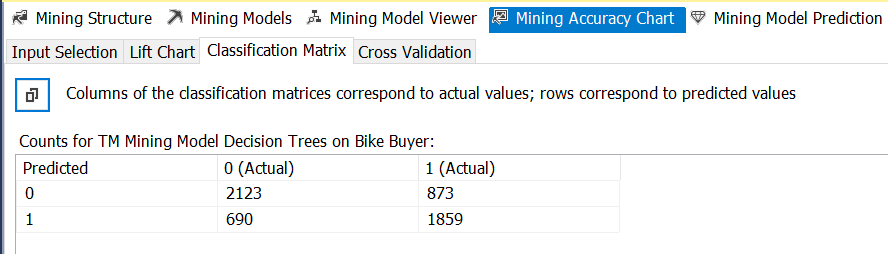
4) The third sub-view in the Mining Accuracy chart view is called the Classification Matrix. This matrix shows the original and predicted values for the Bike Buyer attribute. In the decision tree model, the predictable values for Bike Buyer are 0 or 1. The matrix shows the actual and predicted values for all the specified input rows. There are 2123 + 873 = 2996 input rows that have a Bike Buyer value 0. Of these, the model predicted 2123 of them to the correct value of 0, whereas it predicted the remaining 873 rows incorrectly to value 1. There are 690 + 1859 = 2549 input rows that have a Bike Buyer value 1. Of these, the model predicted 1859 of them to the correct value of 1, whereas it predicted the remaining 690 rows incorrectly to value 0.
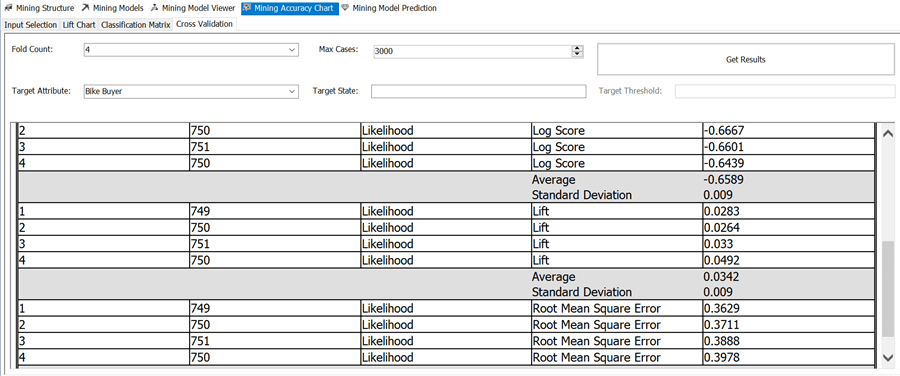
5) Cross validation is a process in which the data set is split into multiple partitions, and a mining model is created for each partition. The training data set corresponding to a mining model for a specific partition is the data set from all the remaining partitions other than the current partition. Analysis Services then evaluates the accuracy of the model using the data set in the current partition. The result will be the quality of the model measured on a partition (also known as fold) using different statistical methods like Standard Deviation, Log Score, Root Mean Square Error, etc. Provide appropriate values for Fold Count and Max Cases and click on "Get Results" button to view the results of the cross-validation method. If you understand statistical methods of validation, this tab will help you validate the accuracy of the model in detail.
This completes analyzing the accuracy of the data mining model. You can go back to the mining model editor and adjust the model as required to improve the accuracy of the model. In the next chapter we will look at the Mining Model Prediction view.
Additional Information
- Cross validation is a very statistics intensive subject and may require deep study to understand it completely. Consider reading this article for more details.
