By: Siddharth Mehta
Overview
Tabular data models are better suited for reporting with Power View, though different reporting tools can use it as a data source. In this chapter we will learn how to browse Tabular Data in Power View and develop Power View reports.
Explanation
The steps to create a Power View report are similar to Excel. Power View is available as an add-in for Excel and we will be using this to create a Power View report using the Tabular Data Model as the data source.
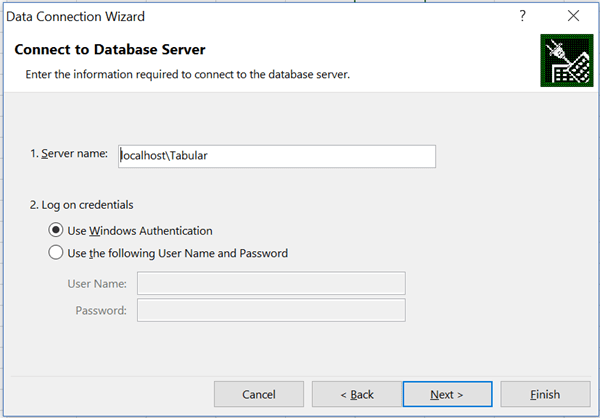
Open Microsoft Excel and select the “Data” tab from the menu ribbon. Click on “From Other Sources” and select “From Analysis Services” option. In the next step specify the SSAS server name and logon credentials. Make sure to specify the tabular instance as your SSAS server as shown below.
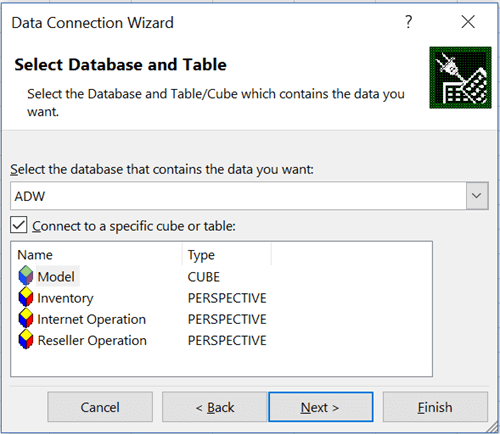
If you were able to successfully connect to the specified SSAS instance with the logon credentials specified, in the next step you should be able to select the SSAS “AdventureWorks” database and find the Cube and Perspectives in the data model. Select the data model and proceed to the next step.
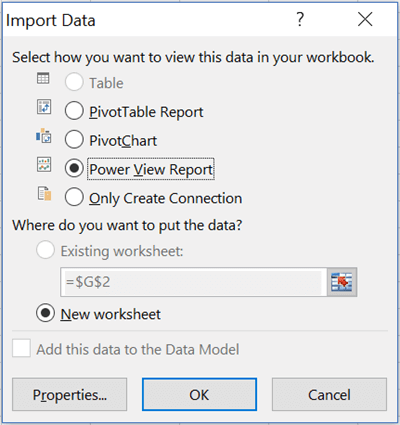
In the next step, specify the name of the connection file to save. This file will be saved as an .ODC file and you can reuse this connection file when you want to use the same connection in other workbooks. After saving the file, you will be prompted with the option to select the kind of report you want to create. We will go with the option of “Power View Report” as shown below. This would open up the Power View design interface and the data elements from the tabular cube should be available as the data source for developing reports.
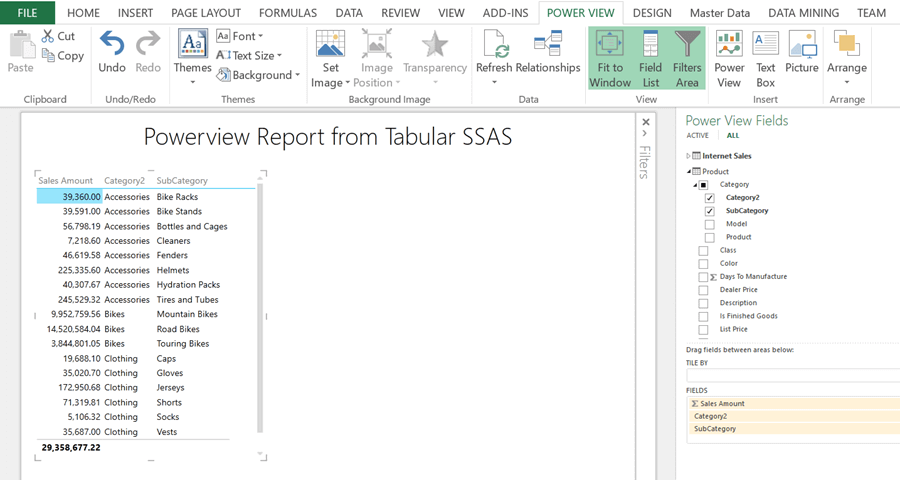
Select the values as shown in the below screenshot and the Power View report that uses the tabular data model as the data source.
Summary
We started this tutorial by taking a quick glance on the evolution of SSAS over different versions. We took our first step towards learning SSAS by understanding few basic definitions, terms and concepts to build a foundation on SSAS basics. To explore the sample SSAS data models, we installed SSAS 2016 in Tabular and Multidimensional mode, and installed sample databases for both the data models.
SSAS can be broadly classified into two types from a data model development perspective - Multidimensional and Tabular. We understood fundamentals, walked through the data model development and deployment approach with an emphasis on key tools and technology aspects, and finally queried the data model using MDX and DAX for Multidimensional and Tabular data models respectively. Finally we browsed the data models using Microsoft Excel as well as Power View to understand how to create quick reports and browse the data model using these tools.
SSAS has evolved drastically since its inception in 2005. I hope this SSAS 2016 tutorial brings a fresh and modern outlook of the latest SSAS version and provides a launch pad to SSAS enthusiasts.
