By: Ben Snaidero
Overview
For anyone not familiar with what a data collector set is exactly, in Performance Monitor it is simply a collection of performance counters, event trace data and/or system configuration information (including registry values).
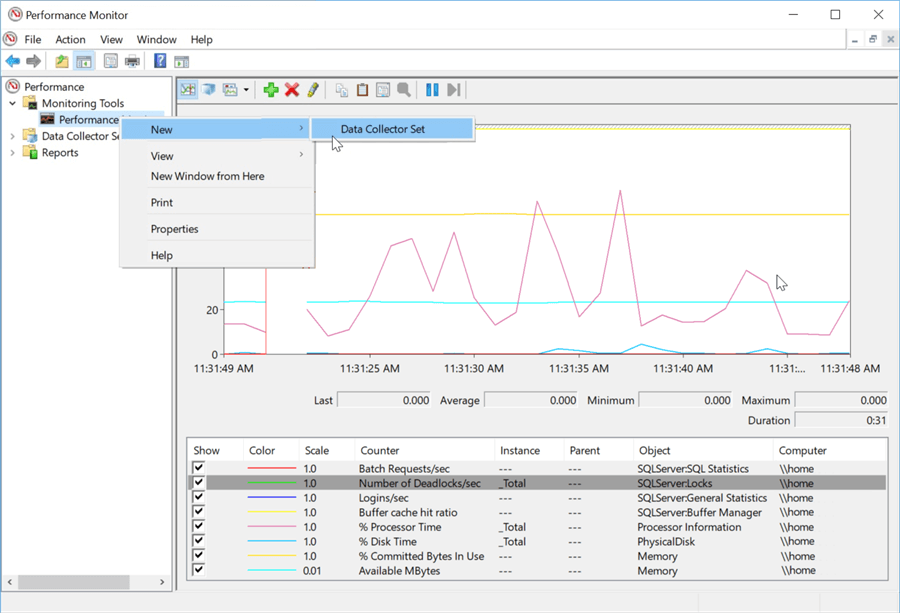
There are a couple ways that you can create a data collector set in Performance Monitor, but the method I find easiest is done by using the counters that we previously added for real-time collection above and right clicking on "Performance Monitor". You then select "New" and then "Data Collector Set" and this will begin the process of defining a data collector set which contains the performance counters you had configured for real-time collection.
The first step in defining the data collector set is creating a unique name which is done in the following screenshot. For this example, we will use "SQL Server-System Monitor" since most of the counters are related to high level performance counters in these two areas.
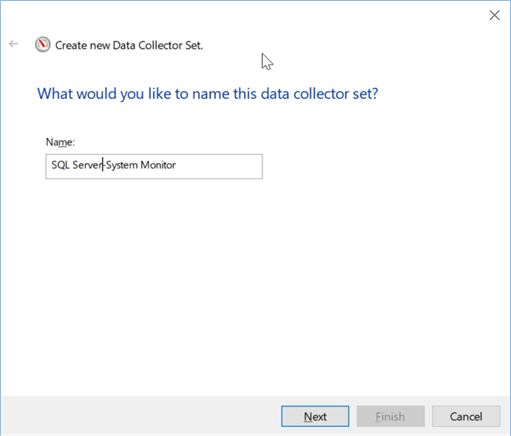
After giving it a name and selecting "Next", another window will open where you can configure where the data for this collector set will be stored.
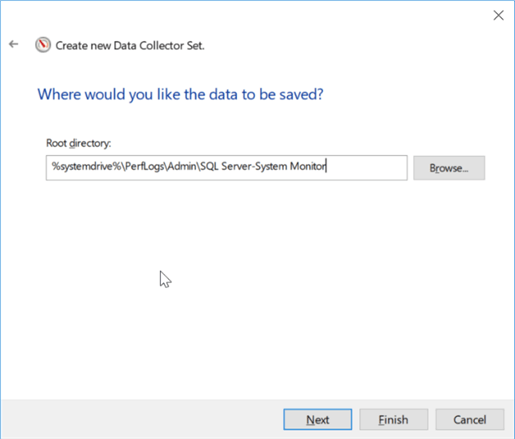
After entering a folder path and clicking Next the final window is displayed where you can either just save the data collector set or start it. For this tutorial we'll just save and close.
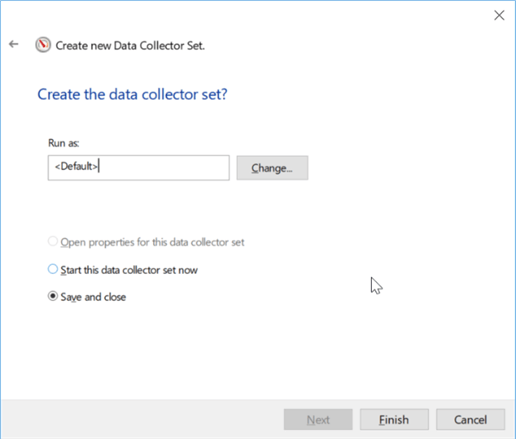
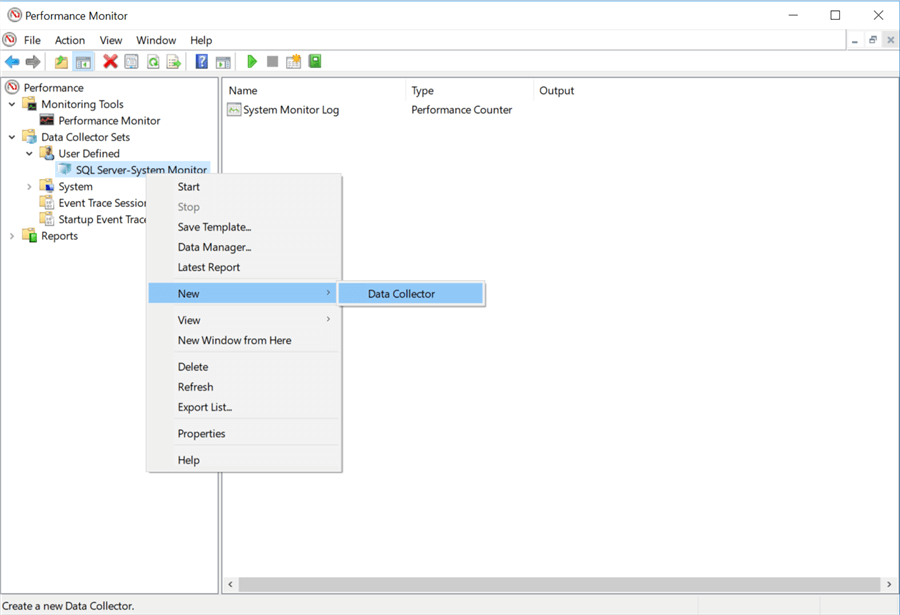
After clicking "Finish" you'll now notice in the window on the left we have our newly created data collector set under the "Data Collector Sets" > "User Defined" folder. From here we can now add more data collectors to this set by right-clicking our data collector set and select "New" > "Data Collector".