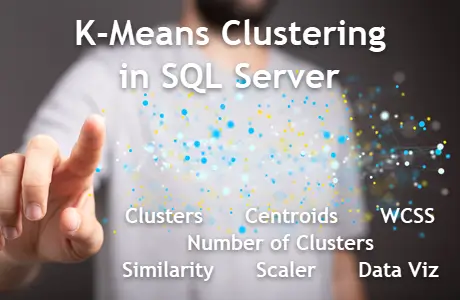
Problem
K-means clustering is an unsupervised machine learning algorithm used to group data into k distinct clusters based on their similarity, allowing for customer segmentation, anomaly detection, trend analysis, etc. The most common machine learning tutorials focus on Python or R. Normally, data is stored in SQL Server, and it is necessary to move data out of the database to apply clustering algorithms and then, if necessary, to update the original data with the cluster numbers. Is it possible to do it directly in SQL Server?
Solution
A K-means implementation in SQL Server allows DBAs and developers to harness the power of clustering techniques using tools they already know.
Terms and Definitions
Cluster
Group of data points coherent and meaningful. The goal is to ensure that the data points inside a cluster are as similar as possible, while data points from different clusters are as different as possible.
Centroid
It is a center point of a cluster. Each cluster is defined by a centroid, which is a central point that represents the average position of all the data points in that group.
Number of Clusters (k)
It is crucial to choose this number once because it affects how well your clustering algorithm captures the true structure of your data. Choosing too few oversimplifies the data and merges distinct groups together, while choosing too many overfits and creates artificial divisions. There are some techniques for this:
- Elbow method: Run k-means for a range of k values and compute the within-cluster sum of squares (WCSS), and when plotting shows the elbow point, where the curve starts to flatten, and adding more clusters does not improve the fit.
- Silhouette score: Ranges from -1 to 1, where higher means better-defined clusters. Measure cohesion versus separation.
- Gap statistic: Selects k based on the largest gap between the real data and random data clustering.
- Business rules: Based on domain knowledge or logic in special when used alongside technical metrics.
Similarity
It is a measure of how alike or close two data points are based on their features or attributes. Usually measured by its distance:
- Euclidean distance: Straight-line between two points; commonly used for numeric data. I will use this for this article.
- Manhattan distance: Sum of the absolute differences; used for grid-based or sparse data.
- Cosine similarity: Measures angles between vectors; used for high-dimensional data like text.
- Jaccard similarity: Based on set overlap, intersection, or union; used in categorical or binary features.
Scaler
It is a technique or function that standardizes or normalizes your data by adjusting the scale of features, ensuring that each feature contributes equally to distance-based calculations, improving convergence. If you have data with ages varying from 18 to 103 years and income varying from 20,000 to 250,000, if not scaling, the income will overpower age, and clusters will be driven mostly by income differences.
- Standard scaler (Z-score normalization): Where mean equals zero and standard deviation equals one. It is best used for normal distribution data and is sensitive to outliers.
- Min-Max scaler: Rescales features to a range from zero to one. It is best used for algorithms that assume bounded inputs, like neural nets, and is sensitive to outliers.
- Robust scaler: Uses median and interquartile range. It is best used for skewed data with outliers.
Within-cluster Sum of Squares (WCSS)
WCSS is the sum of the squared distances between each point and the centroid of its assigned cluster.
Clustering Steps
- Load your data.
- Normalize its values.
- Choose the number of clusters (k).
- Initialize k centroids randomly.
- Assign each point to the nearest centroid.
- Recalculate the centroids.
- Repeat steps 3 and 4 until convergence.
Additional Observations
- Be mindful of the inherent limitations of the clustering results if the data significantly violates the algorithm’s core assumptions; in such cases, consider exploring alternative clustering methods.
- Another crucial tip when dealing with categorical features like ‘Gender’ is to avoid directly assigning numerical values that imply an artificial order or distance. For instance, assuming 0 for females and 1 for males can introduce a bias, leading to misleading numerical distances between data points based solely on gender. Instead, a more appropriate technique is to use one-hot encoding. This involves splitting the ‘Gender’ column into two binary (0 or 1) columns: ‘Gender_Male’ and ‘Gender_Female’. This transformation represents the categorical information in a numerical format that machine learning algorithms can effectively understand and process without assuming any inherent relationship or order between the categories. This prevents the algorithm from being artificially biased by the numerical representation of gender and allows for more accurate distance calculations based on other relevant features.
SQL Solution
Table K-Means
This table will hold our data and its original feature values, and two extra columns to normalize them.
CREATE TABLE [dbo].[KMeans](
    [ItemId] [int] IDENTITY(1,1) NOT NULL,
    [XFeature] [float] NULL,
    [YFeature] [float] NULL,
    [X] [float] NULL,
    [Y] [float] NULL,
    [ClusterId] [float] NULL,
 CONSTRAINT [PK_KMeans] PRIMARY KEY CLUSTERED
(
    [ItemId] ASC
)WITH (PAD_INDEX = OFF, STATISTICS_NORECOMPUTE = OFF, IGNORE_DUP_KEY = OFF, ALLOW_ROW_LOCKS = ON, ALLOW_PAGE_LOCKS = ON, OPTIMIZE_FOR_SEQUENTIAL_KEY = OFF) ON [PRIMARY]
) ON [PRIMARY]
GO
Table Centroids for K-Means
This table will hold the calculated centroids for each cluster.
CREATE TABLE [dbo].[KMeansCentroids](
    [ClusterId] [int] NOT NULL,
    [X] [float] NULL,
    [Y] [float] NULL,
 CONSTRAINT [PK_KMeansCentroids] PRIMARY KEY CLUSTERED
(
    [ClusterId] ASC
)WITH (PAD_INDEX = OFF, STATISTICS_NORECOMPUTE = OFF, IGNORE_DUP_KEY = OFF, ALLOW_ROW_LOCKS = ON, ALLOW_PAGE_LOCKS = ON, OPTIMIZE_FOR_SEQUENTIAL_KEY = OFF) ON [PRIMARY]
) ON [PRIMARY]
GO
Store Procedure K-Means
-- =============================================
-- Author:        SCP - MSSQLTips
-- Create date:   20250515
-- Description:   K-Means clustering
-- =============================================
CREATE OR ALTER PROCEDURE [dbo].[uspKMeans]
                (@k int
                ,@Interactions int)
WITH EXECUTE AS CALLER
AS
BEGIN
    SET NOCOUNT ON;

    IF (SELECT COUNT(*) FROM [dbo].[KMeans]) < 1
        RETURN;

    BEGIN TRY
        BEGIN TRANSACTION;

            DECLARE  @nextClusterId int = 2
                    ,@i int = 0;

            -- Step 1: Assuring that all clusters are null and no centroids choosen =================
            UPDATE       [dbo].[KMeans]
                SET      [ClusterId] = NULL;

            TRUNCATE TABLE [dbo].[KMeansCentroids];

            -- Step 2: Initialize centroids using simplified K-Means++ ==============================

            ---- Pick first centroid randomly
            INSERT INTO  [dbo].[KMeansCentroids]
                SELECT TOP (1)   1 AS [ClusterId]
                                ,[X]
                                ,[Y]
                    FROM         [dbo].[KMeans]
                    ORDER BY     [X]; -- replace [X] by NEWID() if you want undeterministic;

            /*

                I choose the variable [X] to be deterministic, same results in runs
                Since K-Means is sensitive to initial centroids, different initial points
                lead to different clusters, which is the expected behavior.

            */

            ---- Loop to pick remaining k - 1 centroids
            WHILE @nextClusterID <= @k BEGIN
                INSERT INTO          [dbo].[KMeansCentroids]
                                    (ClusterID
                                    ,X
                                    ,Y)
                    SELECT TOP (1)   @nextClusterID
                                    ,X
                                    ,Y
                        FROM        (SELECT      p.X
                                                ,p.Y
                                                ,MIN(SQRT(POWER(p.X - c.X, 2) + POWER(p.Y - c.Y, 2))) AS MinDist
                                        FROM     [dbo].[KMeans] p CROSS JOIN
                                                 [dbo].[KMeansCentroids] c
                                        GROUP BY p.X
                                                ,p.Y) d
                        WHERE        NOT EXISTS
                                    (SELECT      1
                                        FROM     [dbo].[KMeansCentroids] c2
                                        WHERE    c2.X = d.X AND
                                                 c2.Y = d.Y)
                        ORDER BY     MinDist DESC;

                SET @nextClusterID += 1;
            END

            -- Step 3: K-Means Iteration ============================================================
            WHILE @i < @Interactions BEGIN
                -- Assign clusters based on nearest centroid, using Euclidian distance
                WITH Distances AS (
                    SELECT       p.ItemId
                                ,c.ClusterId
                                ,SQRT(POWER(p.X - c.X, 2) + POWER(p.Y - c.Y, 2)) AS Distance
                                ,ROW_NUMBER() OVER (PARTITION BY p.ItemId
                                                    ORDER BY SQRT(POWER(p.X - c.X, 2) + POWER(p.Y - c.Y, 2))) AS rn
                        FROM     [dbo].[KMeans] p CROSS JOIN
                                 [dbo].[KMeansCentroids] c)
                UPDATE           p
                    SET          ClusterID = d.ClusterID
                    FROM         [dbo].[KMeans] p JOIN Distances d ON
                                 p.ItemId = d.ItemId AND
                                 d.rn = 1;

                -- Recalculate centroids
                -- Update Centroids
                DELETE FROM      [dbo].[KMeansCentroids];

                INSERT INTO      [dbo].[KMeansCentroids]
                    SELECT       ClusterId
                                ,AVG(X) AS X
                                ,AVG(Y) AS Y
                        FROM     [dbo].[KMeans]
                        GROUP BY ClusterID;

                SET @i += 1;
            END

        COMMIT TRANSACTION;

        -- Returning WCSS (Within-Cluster Sum of Squares) ===========================================
        SELECT       SUM(POWER(k.X - c.X, 2) + POWER(k.Y - c.Y, 2)) AS WCSS
            FROM     dbo.KMeans AS k INNER JOIN
                     dbo.KMeansCentroids AS c ON
                     k.ClusterId = c.ClusterId;

    END TRY
    BEGIN CATCH
        IF @@TRANCOUNT > 0
            BEGIN
                ROLLBACK TRANSACTION;
            END

        -- Print error information.
        PRINT    'Error: ' + CONVERT(varchar(50), ERROR_NUMBER()) +
                ', Severity: ' + CONVERT(varchar(5), ERROR_SEVERITY()) +
                ', State: ' + CONVERT(varchar(5), ERROR_STATE()) +
                ', Procedure: ' + ISNULL(ERROR_PROCEDURE(), '-') +
                ', Line: ' + CONVERT(varchar(5), ERROR_LINE());
        PRINT ERROR_MESSAGE();
    END CATCH;
END
GO
Example
A clinic has a group of patients with two features, Weight (Kg) and Height (cm), and wants to group them in clusters.
INSERT INTO [dbo].[KMeans]
           ([XFeature]
           ,[YFeature])
     VALUES    (60, 165), (65, 170), ( 72, 175),
            (80, 180), (85, 185), ( 90, 190),
            (55, 160), (50, 158), (100, 195),
            (95, 188), (70, 172), ( 68, 169);
GO
I decided to normalize the data with standard-scaling, applying to each feature its value minus the feature average divided by the standard deviation:
WITH        cteStat
            (XAvg
            ,XStdDev
            ,YAvg
            ,YStdDev) AS
            (SELECT      AVG([XFeature])
                        ,STDEVP([XFeature])
                        ,AVG([YFeature])
                        ,STDEVP([YFeature])
             FROM     [dbo].[KMeans])
UPDATE       [dbo].[KMeans]
    SET      [X] = ([XFeature] - XAvg) / XStdDev
            ,[Y] = ([YFeature] - YAvg) / YStdDev
    FROM     cteStat
    WHERE    XStdDev <> 0 AND
             YStdDev <> 0;
GO
I wrote an article, SQL matrix tools, that shows other normalization approaches.
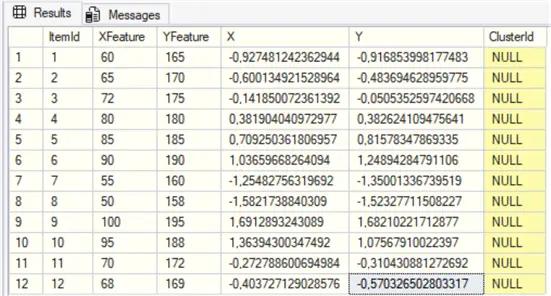
SELECT TOP (1000) [ItemId]
      ,[XFeature]
      ,[YFeature]
      ,[X]
      ,[Y]
      ,[ClusterId]
  FROM [dbo].[KMeans]
GO
Now our features are normalized in X and Y columns:
I will assume 3 clusters and 100 interactions running.
EXEC    [dbo].[uspKMeans]
        @k = 3,
        @Interactions = 100
GO
Now, the data points are organized by cluster, and the store procedure returns the WCSS for the number of clusters chosen. You can graph the WCSS and k to identify the elbow method to look for the ideal number of clusters.
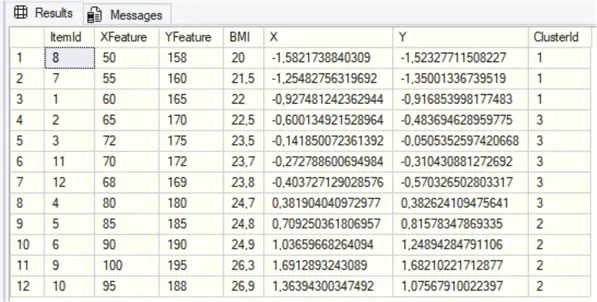
There is a medical term called Body Mass Index (BMI Calculator), which is the Weight divided by the squared Height in meters. Let’s have a look:
SELECT       [ItemId]
            ,[XFeature]
            ,[YFeature]
            ,ROUND([XFeature] / SQUARE([YFeature] / 100.0),1) as [BMI]
            ,[X]
            ,[Y]
            ,[ClusterId]
    FROM     [dbo].[KMeans]
    ORDER BY [BMI]
            ,[ClusterId];
This returns the Weight (X Feature), Height (Y Feature), BMI, X, Y, and Cluster Id columns. Note the relation between the BMI and the Cluster Id. Do not interpret cluster numbers as cluster order.
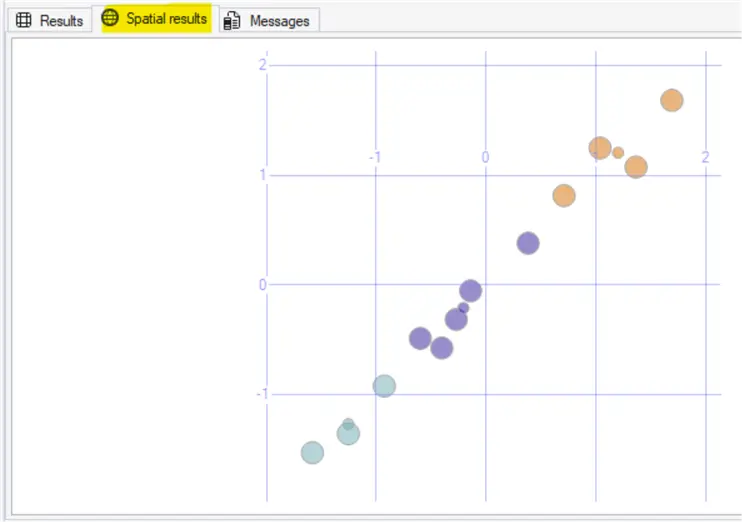
If you want to visualize it in the Spatial Results tab in SSMS, run the following:
SELECT       geometry::CollectionAggregate(SpatialPoint) AS geom
    FROM    (SELECT       [ClusterId]
                        ,([geometry]::Point([x],[y],(0))).STBuffer(0.1) as SpatialPoint
                FROM      [dbo].[KMeans]

             UNION ALL

             SELECT       [ClusterId]
                        ,([geometry]::Point([x],[y],(0))).STBuffer(0.05) as SpatialPoint
                FROM      [dbo].[KMeansCentroids]

                ) AS X
    GROUP BY [ClusterId];
The cluster individual data points and its centroids are plotted:
You can improve the data visualization using Power BI or Report server.
Next Steps
For this article, I used only two features X and Y, but a similar approach can be used to add more.
