Problem
Exponential moving averages (emas) are a powerful means of detecting changes in time series data. However, if you are new to this task, you may be wondering how to choose from conflicting advice about how to calculate emas. This tip reviews several of the most popular methods for calculating moving averages. Additionally, this tip presents T-SQL code samples with common table expressions and stored procedures for generating emas from an underlying time series dataset.
“Emas don’t just track trends—they reveal momentum in motion.” That’s why they’re favored when recent values matter most—and why this tip focuses on helping you calculate them with precision.
Solution
Moving averages are for smoothing out random variations in a set of values across time series. The two most common moving averages are the simple moving average (sma) and the exponential moving average (ema). The hyperlink references at the end of this section provide resources for helping you to grow your understanding of moving averages with definitions, calculation examples, and sample applications for smas and emas.

Why Use Emas
When it is important for your average values to represent recent values especially well, then the ema is the preferred kind of average. This is because the simple moving average weights all underlying values equally, but the exponential moving average weights the most recent values more heavily than the preceding underlying values. Furthermore, the weights for the observations of less recent underlying values decline exponentially in accordance with their proximity to the most recent observation.
Data professionals can encounter time series data in lots of different contexts.
- Nuclear power generation plants may have one or more compliance monitoring programs to assure regulators that their plant either currently adheres to or is improving its adherence to licensing standards.
- Another typical use case for emas is to assess if financial security prices are trending up, down, or sideways. Security owners typically seek to hold securities whose prices are trending up and dispose of securities whose prices are trending sideways or down.
- Statistical process control (SPC) for making semiconductors or any mass-produced product of high value is another domain that can benefit from emas. Statistical process control uses emas and normal distributions to provide early warning signals for manufactured batches that are outside of acceptable consistency standards.
- Database administrators have similar issues apply to their domain. For example, a suite of ETL jobs with rising run times and/or storage requirements as reflected by their ema values should be examined for root causes as well as associated software and/or hardware remedial actions. Similarly new indexes and keys added to a database should result in improved performance and lower levels of capacity utilization.
This tip introduces you to expressions for calculating emas. Additionally, this tip’s code samples utilize ctes and stored procedures for calculating ema values.
Reference Links
The following list of references includes additional resources for you to expand your understanding of how to calculate emas as well as use cases for emas.
- Single Exponential Smoothing
- What is Exponential Moving Average? EMA formula, and how it works
- Moving average
- Moving Averages – Simple and Exponential
- Exponential Moving Average Calculation in SQL Server
- 2 major applications for ewma
- Keeping the Process on Target: EWMA Chart
- EWMA Chart
- Exponential Moving Averages in the Semiconductor Industry: A Comprehensive Analysis of Applications in Statistical Process Control and Financial Markets
- The Only Moving Average Trading Video You’ll Ever Need
- Exponential Moving Average (EMA): Definition, Formula, and Usage
- How Is the Exponential Moving Average (EMA) Formula Calculated?
Exponential Smoothing Expression
Emas are computed by the following exponential smoothing equation.
St = αxt + (1-α) St-1
where
- t = time periods 1, 2, 3, … , N,
- St = ema for time period t,
- St-1 = ema for time period t-1,
- α = the smoothing parameter value,
- xt = underlying value for time period t, and
- α + (1-α) = 1
The ema expression requires a seed value for St-1 in order to compute St. If the series of calculated ema values start at time period 2, then one common way of designating a value for St-1 is to use x1. This tip will demonstrate how to implement this approach as well as another approach based on an initial sma value calculated over a period length.
The appropriate value of α in the exponential smoothing can be assigned based on domain as well as use case rules. For example,
- When computing emas for financial time series, it is common to compute α as the ratio of 2/(p+1) where p is the period length for the ema values.
- A value of .2 is frequently recommended for α in the statistical process control domain.
- When using the exponential smoothing equation to forecast the next value in a time series, it is common to base α on the minimum loss function value for the root mean squared differences between historical values and backtested projected values.
CTE for Calculating Emas
The following script shows a basic example of how to calculate with a cte ema values for an underlying time series. The input for the script is from the dbo.ticker_date_price table; this table has historical price data for three tickers (DIA, IWM, and SPY). The output from the script is a temporary result set returned by a common table expression named ema_cte.
The Script Steps
- Step 1 begins by setting the context to the T-SQLDemos database. Next, the code declares a local variable (@period) for the period length of the ema values. In the script below, the period length is set equal to 21, but you can overwrite this value to whatever other period length suits your purposes. In my financial analysis work, I frequently use period lengths of 5, 10, 30, 50, and 200. A second declare statement in Step 1 declares and calculates the ema smoothing factor (α) based on the @period local variable.
- Step 2 defines a recursive cte for computing the ema values for the underlying price values in the dbo.ticker_date_price table.
- The anchor member of the recursive cte
- selects the first row per ticker (based on the earliest date),
- seeds the ema values for each ticker with the ticker’s initial price value, and
- assigns a row number (rn) to support recursive joining.
- The recursive member combines the anchor member with the recursive logic by
- applying the exponential smoothing expression ((curr.price * @smoothing_factor) + (prev.ema * (1 – @smoothing_factor)),
- joining each row to its predecessor using rn to maintain order, and
- ensuring ema values are computed per ticker across time.
- The anchor member of the recursive cte
- Step 3 is for displaying the final output which consists of calculated ema values alongside ticker, date, and price and orders results chronologically per ticker. Step 3 removes the recursion depth limit to allow full series ema calculations per ticker.
SQL Script
-- script with cte (i.e., ema_cte) to compute
-- ema values for price having a period length
-- of @period where seed ema value is the
-- initial underlying price value
-- Step 1: Sample Setup
use [T-SQLDemos];
declare @period int = 21;
declare @smoothing_factor float = round(2.0 /(@period + 1), 6);
-- Step 2: Recursive CTE Definition
with ema_cte as (
-- anchor: first row per ticker
select
ticker,
date,
price,
cast(price as decimal(10,6)) as ema,
row_number() over (partition by ticker order by date) as rn
from dbo.ticker_date_price
where date = (
select min(date)
from dbo.ticker_date_price tp2
where tp2.ticker = dbo.ticker_date_price.ticker
)
union all
-- recursive step: apply EMA formula
select
curr.ticker,
curr.date,
curr.price,
cast((curr.price * @smoothing_factor)
+ (prev.ema * (1 - @smoothing_factor)) as decimal(10,6)) as ema,
curr.rn
from ema_cte prev
join (
select
ticker,
date,
price,
row_number() over (partition by ticker order by date) as rn
from dbo.ticker_date_price
where price is not null
) curr
on curr.ticker = prev.ticker and curr.rn = prev.rn + 1
)
-- Step 3: Final Output
select ticker, date, price, ema
from ema_cte
order by ticker, date
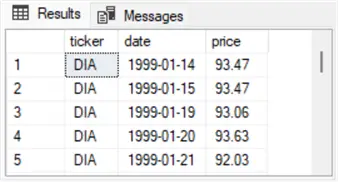
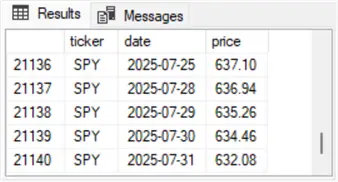
option (maxrecursion 0);The following pair of screenshots display the first five and last five data rows from the dbo.ticker_date_price table. As you can see, the first five rows are for the DIA ticker, and the last five rows are for the SPY ticker. The rows for the IWM ticker are between the last row for the DIA ticker and the first five row for the SPY ticker.
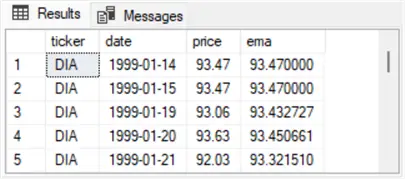
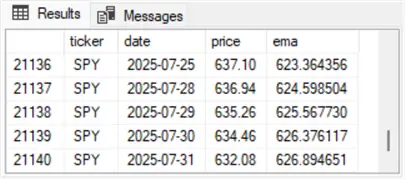
The next pair of screenshots show the first five and last five rows from the select statement in Step 3 of the preceding script. As in the preceding pair of screenshots, the first member is for the DIA ticker, and the second member is for the SPY ticker. Notice that the following two screenshots include an additional column for ema values. These values are calculated in Step 2 of the preceding script and displayed in Step 3.
Stored Procedure for Calculating Emas Based on an Input Parameter for Period Length
This section’s script builds on the script from the preceding section in a couple of areas.
- First, it embeds the cte from the preceding section (ema_cte) into a stored procedure, which has an input parameter for the period length of the returned ema return values.
- Second, it stores ema values from successive runs in a single table ([dbo].[ticker_ema_history]). Successive runs are denoted by a run_timestamp field value.
- Third, it displays all distinct historical period and run_timestamp field values. Ema value sets for each successive run are also displayed.
The Script Steps
There are five steps to the script.
- Step 1 performs two functions:
- switches context to a default database (T-SQLDemos),
- conditionally creates dbo.ticker_ema_history, including data fields like ticker, date, price and ema as well as metadata fields like period and run_timestamp, if the table does not already exist.
- Step 2 defines a fresh version of the dbo.usp_calculate_ema stored proc that includes an input parameter for the period length and a local variable for the smoothing factor of the current ema value set.
- Step 3
- reuses the recursive cte logic from your first sample, and
- computes ema values per ticker across time using row numbers to maintain order.
- Step 4 persists data fields and metadata fields.
- Step 5
- executes the dbo.usp_calculate_ema stored procedure for a period length of twenty-one and
- displays the metadata fields as well as historical data fields.
SQL Script
-- Embed the cte (ema_cte) from the preceding code sample
-- in a stored proc. Persist the computed ema values in a
-- a SQL Server table (dbo.ticker_ema_history). The stored proc
-- accepts a parameter for the period length of the ema series.
-- Step 1: Setup – Conditional Creation of dbo.ticker_ema_history table
use [T-SQLDemos];
-- Setup: Create table only if it doesn't exist
if not exists (
select *
from sys.objects
where object_id = object_id(N'[dbo].[ticker_ema_history]') and type = 'U'
)
create table dbo.ticker_ema_history (
ticker nvarchar(20),
date date,
price decimal(10,6),
ema decimal(10,6),
period int,
run_timestamp datetime default getdate()
);
-- Step 2: Stored Procedure Definition
-- Drop and recreate stored procedure
if object_id('dbo.usp_calculate_ema', 'p') is not null
drop procedure dbo.usp_calculate_ema;
go
create procedure dbo.usp_calculate_ema
@period int
as
begin
set nocount on;
declare @smoothing_factor float = round(2.0 / (@period + 1), 6);
-- Step 3: Recursive CTE Logic
with ema_cte as (
select
ticker,
date,
price,
cast(price as decimal(10,6)) as ema,
row_number() over (partition by ticker order by date) as rn
from dbo.ticker_date_price
where date = (
select min(date)
from dbo.ticker_date_price tp2
where tp2.ticker = dbo.ticker_date_price.ticker
)
union all
select
curr.ticker,
curr.date,
curr.price,
cast(
(curr.price * @smoothing_factor) +
(prev.ema * (1 - @smoothing_factor))
as decimal(10,6)
) as ema,
curr.rn
from ema_cte prev
join (
select
ticker,
date,
price,
row_number() over (partition by ticker order by date) as rn
from dbo.ticker_date_price
where price is not null
) curr
on curr.ticker = prev.ticker and curr.rn = prev.rn + 1
)
-- Step 4: Persist results
insert into dbo.ticker_ema_history (ticker, date, price, ema, period)
select ticker, date, price, ema, @period
from ema_cte
option (maxrecursion 0);
end
go
-- Step 5: Execution and display results
exec dbo.usp_calculate_ema @period = 21;
-- list distinct period and run_timestamp values
-- in dbo.ticker_ema_history
select period, run_timestamp
from dbo.ticker_ema_history
group by period, run_timestamp;
-- display ema values for least recent run_timestamp
select *
from dbo.ticker_ema_history
where run_timestamp
= (select min(run_timestamp) from dbo.ticker_ema_history)
order by run_timestamp, ticker, date, period;
-- display ema values for most recent run_timestamp
select *
from dbo.ticker_ema_history
where run_timestamp
= (select max(run_timestamp) from dbo.ticker_ema_history)
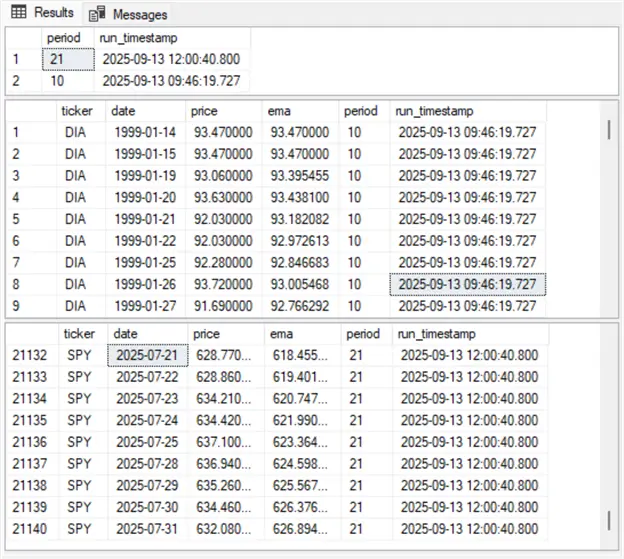
order by run_timestamp, ticker, date, period;The following three Results panes are from the select statements in Step 5 of the preceding script. Step 5 was executed twice in two successive runs.
- The first Results pane shows the metadata for each run. The run_timestamp column value reflects when the stored procedure posts an ema value set to the dbo.ticker_ema_history table, and the period column value reflects the period length passed to the stored procedure for that run.
- The stored procedure posted its first ema value set at approximately 9:46 AM on 2025-09-13. The ema value set was calculated for a period length of 10.
- At approximately 12 noon on the same day, the stored procedure posted results a second time to the dbo.ticker_ema_history table. This second set of ema values have a period length of 21.
- The second Results pane shows the first 9 rows from the result set that was initially posted (at approximately 9:46 AM on 2025-09-13). All these rows reflect values for the DIA ticker.
- The third Results pane shows the last 9 rows from the result set that was posted later on the same day. All these rows reflect values for the SPY ticker.
- In between the result sets for the DIA and SPY tickers there was another set of rows with ema value sets for the IWM ticker.
Stored Procedure for Calculating Emas Based on a SMA Seed Value
This section’s script presents an altered version of the script from the preceding section primarily by seeding its calculated ema value sets from an sma based on the period length for each calculated ema value set. The stored procedure created in this section has the name dbo.usp_calculate_ema_from_sma_seed. Recall that there are three tickers (DIA, IWM, and SPY) in the underlying time series dataset.
Successive runs of the script have their ema value sets stored in the dbo.ticker_ema_history_from_sma_seed table. As with the preceding section’s historical ema value set table (dbo.ticker_ema_history table), the ema value sets from this section are saved along with the period and run_timestamp fields.
As with the script in the preceding section, there are five steps in the script for this section. Aside from the stored procedure name and the historical ema value set table name, the script steps for this section are very similar to those in the preceding section, except for the code in step 3. The code in step 3 of the following script seeds its returned ema value sets based on the sma for the period length specified when invoking dbo.usp_calculate_ema_from_sma_seed stored procedure. Comments at the top of the following script reveal additional details about where what and how ema values are initially populated.
SQL Script
-- Start an ema value set based on a seed value
-- of the sma over the first p underlying values
-- where p is the period length of the ema value set.
-- The first p-1 ema are null.
-- The p_th ema value is the sma.
-- Ema values after the p_th ema value are
-- calculated via the exponential smoothing expression.

-- Step 1: Setup – Conditional Creation of dbo.ticker_ema_history_from_sma_seed table
use [t-sqldemos];

-- setup: create table only if it doesn't exist
if not exists (
  select *
  from sys.objects
  where object_id = object_id('dbo.ticker_ema_history_from_sma_seed') and type = 'u'
)
create table dbo.ticker_ema_history_from_sma_seed (
  ticker nvarchar(20),
  date date,
  price decimal(10,6),
  ema decimal(10,6),
  period int,
  run_timestamp datetime default getdate()
);

-- Step 2: Stored Procedure Definition
-- Drop and recreate stored procedure
if object_id('dbo.usp_calculate_ema_from_sma_seed', 'p') is not null
  drop procedure dbo.usp_calculate_ema_from_sma_seed;
go

create procedure dbo.usp_calculate_ema_from_sma_seed
  @period int
as
begin
  set nocount on;
  declare @smoothing_factor float = round(2.0 / (@period + 1), 6);

  -- Compute sma seed per ticker
  with base_data as (
    select
      ticker,
      date,
      price,
      row_number() over (partition by ticker order by date) as rn
    from dbo.ticker_date_price
    where price is not null
  ),
  sma_seed as (
    select
      ticker,
      avg(price) as sma_seed
    from base_data
    where rn <= @period
    group by ticker
  ),
  ema_base as (
    select
      bd.ticker,
      bd.date,
      bd.price,
      cast(ss.sma_seed as decimal(10,6)) as ema,
      bd.rn
    from base_data bd
    join sma_seed ss
      on bd.ticker = ss.ticker
    where bd.rn = @period
  ),
-- Recursive CTE Logic
  ema_cte as (
    select * from ema_base

    union all

    select
      curr.ticker,
      curr.date,
      curr.price,
      cast(
        (curr.price * @smoothing_factor) +
        (prev.ema * (1 - @smoothing_factor))
        as decimal(10,6)
      ) as ema,
      curr.rn
    from ema_cte prev
    join base_data curr
      on curr.ticker = prev.ticker and curr.rn = prev.rn + 1
  )

-- Step 4: Persist results
  insert into dbo.ticker_ema_history_from_sma_seed (ticker, date, price, ema, period)
  select ticker, date, price, ema, @period
  from ema_cte
  option (maxrecursion 0);
end
go

-- Step 5: Execution and display results
exec dbo.usp_calculate_ema_from_sma_seed @period = 21;

-- list distinct period and run_timestamp values
-- in dbo.ticker_ema_history_from_sma_seed
select period, run_timestamp
from dbo.ticker_ema_history_from_sma_seed
group by period, run_timestamp;

-- display ema values for least recent run_timestamp
select *
from dbo.ticker_ema_history_from_sma_seed
where run_timestamp = (select min(run_timestamp) from dbo.ticker_ema_history_from_sma_seed)
order by run_timestamp, ticker, date, period;

-- display ema values for most recent run_timestamp
select *
from dbo.ticker_ema_history_from_sma_seed
where run_timestamp = (select max(run_timestamp) from dbo.ticker_ema_history_from_sma_seed)
order by run_timestamp, ticker, date, period;
Results
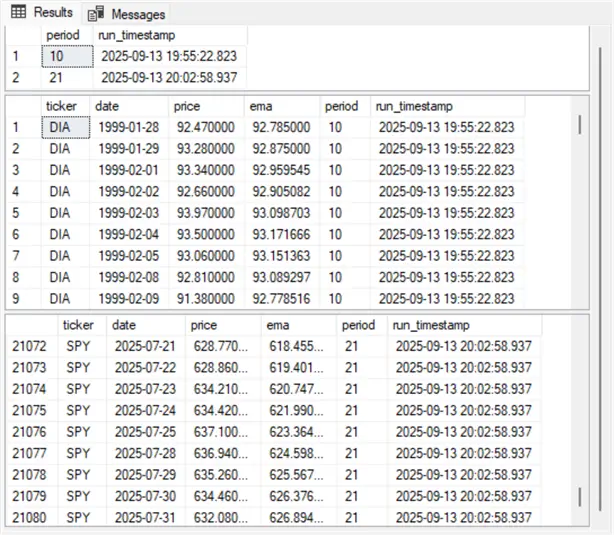
The following three Results panes are from the select statements in Step 5 of the preceding script. Step 5 was executed twice in two successive runs with period length parameter values of 10 and 25, which appear in the first Results pane.
The second Results pane shows the first nine rows from the second select statement in step 5. Notice that the series in this Results pane does not start until 1999-01-28. The ema column value (92.785) on this date is the sma for the first ten rows in the DIA underlying price series. This seed value is for St-1 in the exponential smoothing expression.
The third Results pane shows the last nine ema values. Although the seed date and ema values in this section are different than in the preceding section, the last nine date and ema values for the SPY ticker are identical in this section and the preceding one. This confirms that the starting date and underlying value may be less important than some authors assert for calculated ema values.
Summary
This tip demonstrates three approaches for calculating emas in SQL Server:
- A stand-alone cte seeded with the first time series value
- A stored procedure version of the same logic, with input parameters and persistent result tracking
- A modified stored procedure that seeds ema values with a sma
Each method offers a different entry point for exploring EMA behavior. The first is quick to configure but does not retain results across runs. The second adds lifecycle tracking via run_timestamp and period fields, allowing you to compare how EMA values evolve with different smoothing parameters. The third introduces SMA-based seeding based on a designated period length for the calculated ema values.
Any application of the exponential smoothing expression requires a seed value (St-1) and a smoothing factor value (α), but the expression does not designate how to derive seed and smoothing values. For example, within this tip we referenced three different approaches to estimating an appropriate smoothing factor value and a couple of different approaches to estimating a seed value. In addition, there are other appropriate estimating techniques beyond those mentioned in this tip.
Next Steps
To deepen your understanding of ema calculating techniques, try running both stored procedures in this tip with varying period lengths and seed values. Track the resulting ema values across tickers and period lengths. Compare how alternative seeding strategies affect early values—and how quickly those differences fade. This kind of metadata-aware exploration can help you to choose the approach that best fits your analytical context.
