By: Rob Fisch | Comments (6) | Related: > Reporting Services Best Practices
Problem
Using the Business Intelligence Development Studio, you can bang out some fairly nice, basic reports with the Report Wizard without much effort. But making your reports sizzle with all the bells and whistles of a professionally created report, requires some customization. There are so many options in all the object property windows, it is difficult for beginning users to know what they all do. How does one know where to start and which options to learn first?
Solution
Check this crib sheet of some of the most commonly used properties options in the Microsoft SQL 2005 Report Designer. This list is by no means inclusive. There are many, many reporting options to choose from. These are just a few that might give you the most bang for the buck, while not being as obvious as some of the others.
Report Properties
To access the Report Properties, click on the little gray square in the top left corner or in the pale yellow section outside the report layout area.
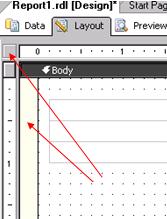
Once selected, the following properties areas are displayed.
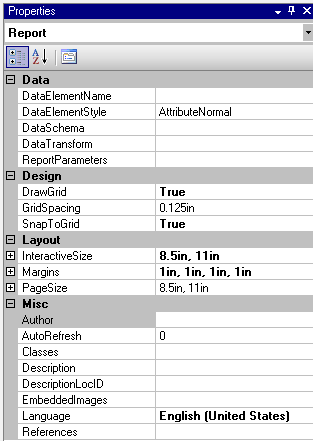
Report Property options:
-
SnapToGrid - For finer control of object sizes, set the SnapToGrid property to False. Once done, you can resize rows, columns, textboxes, etc. to more exact dimensions.
-
InteractiveSize - To achieve one long scrollable web page, change height property (expanc InteractiveSize) to 0. Note: With reports that are very long, this can adversely affect report rendering times. Experiment, use judgement, and obtain feedback from users. Educate your users as to the pros and cons of this.
-
PageSize - The default is 8.5in, 11in. This is a standard portrait letter size page size. For landscape printing, swap the width and height (to 11in, 8.5in). Coordinate these changes with the InteractiveSize. (i.e. If you want to print landscape, but see one long scrollable page in the web browser before printing, set the InteractiveSize to a width of 11in, and a height of 0.)
-
Description - With Reporting Services (RS) in Native mode (not Sharepoint Integration mode), text you write in this property is displayed in the Report Manager and the WSS2 Reporting Services report viewer web part. For RS in Sharepoint Integration mode the entry has no affect. (For Sharepoint Integrated installations, you can add a field to the reporting document library and put the description there.)
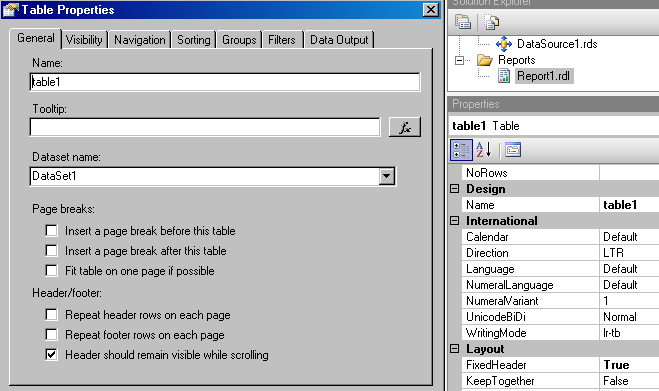
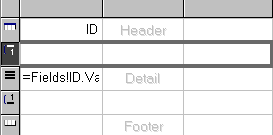
Table Properties
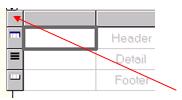
Click on the top left square in a table to expose the table properties windows. When your table has the control points exposed, you can access the table properties.
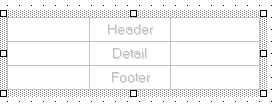
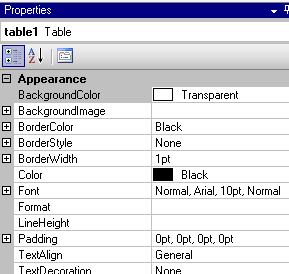
Table properties:
-
DataSetName - Got have one, even if you are doing something creative like displaying some sort of header table. Almost every report I create has a dataset called ‘header'. I use this with a table to display the report logo graphic and some identifying fields (i.e. report runtime, username, report title, etc). This dataset is just a placeholder without any real content. Sometimes I use select statements like "Select getdate()" or "Select 1".
-
NoRows - Depending on data selection criteria and/or parameters chosen by users, your report may yield no results (no rows). (Or your backend server might be down...yikes!) This option allows you to display a custom message to users in the event there is no data to display. (i.e. "The parameters you chose contains no data...please change your parameter choices and try rerunning the report".)
-
FixedHeader - Set to "True", this is the same as the "Header should remain visible while scrolling" checkbox in the Table Properties pop up window. It's really a slick feature.
Textbox properties within a table
-
BackgroundColor - Background color of the textbox
-
BorderStyle - I prefer "Solid" most of the time
-
Color - Means font color
-
Format - Used for various number, percentage, date, text formatting. For Dates without time use ‘d'. For integers, use ‘N0'. For fixed decimals use N and then a number. ‘N4' is a number with 4 decimals. Use ‘P1' for a percentage with 1 decimal place. Check BOL for more formatting codes.
-
Visibility - Another favorite, but deserves it's own tip. Another day...
-
CanGrow - ‘True' most of the time, but I like to use ‘False' if I don't want lines to wrap. In that event, I add the field to the Tooltip in the properties window of the textbox.
Group Properties
In the Properties section...
RepeatOnNewPage - Does what it implies.
Visibity - Use for drill downs.
Select the entire row of the group, right-click on it and select "Edit Group" (not Properties).
Don't forget to put in an option for Sorting the group.
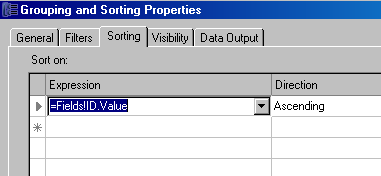
(This isn't really a "Property", but it's in the "Grouping and Sorting Properties" configuration screen so I though I would mention it.)
Next Steps
-
Once you master these property options, you'll be ready to take on more Reporting Services challenges.
-
Take a look at these other Reporting Services tips


About the author
 Rob Fisch has worked with SQL Server since version 6.5 as a dba, developer, report writer and data warehouse designer.
This author pledges the content of this article is based on professional experience and not AI generated.
View all my tips
