By: Kun Lee | Comments (2) | Related: > Tools
Problem
Everyone knows that PerfMon is a great tool to monitor and maintain metrics about SQL Servers. Perfmon offers a great way to collect a baseline then compare it to current statistics when there is a problem in order to find the bottleneck. Everyone agrees, there is no clear threshold per metric, i.e. if you are over "xxx", your server is good or bad. As such, I wrote an article about "Setting up Performance Monitor to always collect SQL Server performance statistics" and "Creating SQL Server performance based reports using Excel". If you have a few servers, it is easy to setup manually; however, if you have hundreds of servers, you are probably better off using a third party tool because you probably have the budget to support it. If you are in the middle, you are on your own to write tools. Making the decision to collect data or not collecting can be a costly one when you are in emergency because it takes time to setup and collect the data. So how do I get started down the right path?
Solution
Microsoft already has a few great tools that you can use to help you to use PerfMon easier, they are Logman and Relog. By the way, many thanks to Chad Boyd for telling me about Logman and Relog.
Here is a brief overview of the tools:
- Performance Monitor Wizard - This wizard simplifies creating and managing performance monitor logs.
- Relog - Extracts performance counters from performance counter logs into other formats, such as text-TSV (for tab-delimited text), text-CSV (for comma-delimited text), binary-BIN, or SQL.
- Logman - Manages and schedules performance counter and event trace log collections on local and remote systems.
Performance Monitor Wizard Tools
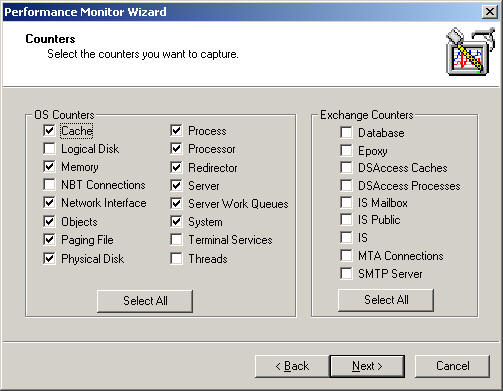
This is the quickest and easiest way to setup Perfmon. Once you download the unzip the file, you will see one executable file "PerfWiz.exe" and if you run it, it will ask the questions below:
- Computer name that you want to monitor from.
- Three different types of collect methods (Standard, High CPU and Advance Configuration). See the screenshot below for Advance Configuration selections.
- Target Computer that you want to monitor.
- Additional configurations.

This tool is simple and with a low learning curve, so you can hit the ground running immediately. The tool good predefined "Exchange Counters" but does not have "SQL Counters". However it has very general System Counters so this is useful if you want to spend less then 2 minutes to configure the tool. Then you can let the performance monitor and afterwards can add your own objects to monitor.
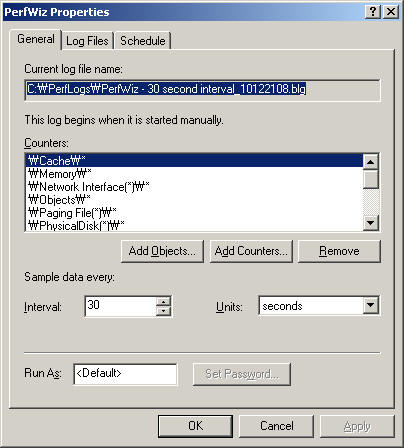
Here is how the tool looks after setup is completed:

Relog - Extracts performance counters from performance counter logs into other formats, such as text-TSV (for tab-delimited text), text-CSV (for comma-delimited text), binary-BIN, or SQL.
This tool is very useful when you are collecting many counters. This is especially the case if you are saving as the results as a ".csv" file when you have Microsoft Office 2003 or older version because Office has a few different limitations. This tool can also be handy when you have CSV files or binary file that you want to load to SQL server. This tool enables you to query the data or integrated it with Reporting Services and so on. Here is a sample command:
| relog PerfMon_MyComputer.csv -cf counter_file.txt -f CSV -o PerfMon_Filtered.csv |
Here is how you can use the tool to load the csv file to SQL server. This command uses ODBC so you need to create an ODBC connection called "PerfMonODBC" in order for it to work properly.
| relog PerfMon_MyComputer.csv -cf counter_file.txt -f SQL -o "SQL:PerfMonODBC!PerfMon_MyComputer.csv" |
Here is the sample "counter_file.txt"
| (PDH-CSV 4.0) (Eastern Standard Time)(300) \\MYCOMPUTER\LogicalDisk(C:)\% Disk Time \\MYCOMPUTER\LogicalDisk(E:)\% Disk Time \\MYCOMPUTER\LogicalDisk(F:)\% Disk Time \\MYCOMPUTER\LogicalDisk(T:)\% Disk Time \\MYCOMPUTER\LogicalDisk(V:)\% Disk Time \\MYCOMPUTER\LogicalDisk(O:)\% Disk Time \\MYCOMPUTER\LogicalDisk(U:)\% Disk Time \\MYCOMPUTER\LogicalDisk(_Total)\% Disk Time \\MYCOMPUTER\Processor(_Total)\% Processor Time \\MYCOMPUTER\SQLServer:SQL Statistics\Batch Requests/sec \\MYCOMPUTER\SQLServer:SQL Statistics\SQL Compilations/sec \\MYCOMPUTER\SQLServer:SQL Statistics\SQL Re-Compilations/sec |
Logman - Manages and schedules performance counters and event log trace collections on local and remote systems.
Basically, this is commend line way to create perfmon counters with a predefined script. That way you can choose the counter that you typically use and just run a simple batch file to deploy the perfmon counters on different servers. This is my favorite command as well.
Here is a sample command that will create a perfmon_file counter on local computer that saves as "C:\PerfLogs\PerfLogs_mmddhhmm.csv" file.
| logman create counter PerfMon_File -m start -V mmddhhmm -f csv -o C:\PerfLogs\PerfLogs -s %COMPUTERNAME% -cf Counter_DEMO.txt -si 05:00 |
This does not have all of the options that I wanted setup, but at least this can deploy the perfmon counters then you can open the file to change it as I typically do from the "Setting up Performance Monitor to always collect SQL Server performance statistics" tip that I contributed earlier.
Here are the detailed steps:
- Save "Counter_DEMO.txt" and "PerfMon_DEMO_FILE.bat" (change file extension from "txt" to "bat") on the same directory. I assume you will create a folder called "C:\PerfMonScript\"
- Open "Counter_DEMO.txt" and replace the "\\SERVERNAME\" with your computer name that you want to monitor.
- Run "PerfMon_DEMO_FILE.bat"
- Open "PerfMon" to verify you see the "Perfmon_File" counters.
- Adjust the options as you like. You can see "Setting up Performance Monitor to always collect SQL Server performance statistics" tip for detailed options.
I hope I described the steps in enough detail for you to follow. I also hope you can use this tool to generate value to your organization like I have. I really like these tools.
Next Steps
- You can configure PerfMon to collect data directly and store it in a SQL server database. To me the benefit of having that configuration is that you can learn trends by analyzing the data to understand the performance of your server. This can help prepare for upgrades, troubleshooting, etc. I have written a few scripts to aggregate the data and setup a report on top of it, which I might share in a future tip.
- In addition, you can setup alerts based on the data. For example, you can setup a general rule for CPU utilization alerting based on recent trends or based on comparisons to comparable points in time during the week.
- Check out my recent Perfmon tips:
About the author
 Kun Lee is a database administrator and his areas of interest are database administration, architecture, data modeling and development.
This author pledges the content of this article is based on professional experience and not AI generated.
View all my tips


