By: Siddharth Mehta | Comments | Related: 1 | 2 | 3 | > Database Design
Problem
SQL Server Modeling CTP - Nov 2009 Release 2 which was formerly known as Oslo has been released and it ships with tools like Intellipad and Quadrant and also with languages like "M". In my view, these services and tools are more targeted towards .NET applications, but there are some features which database developers and DBAs can use to their advantage. Quadrant is one of these and in this tip we explore how this tool can be used for modeling and data analysis.
Solution
Quadrant is a tool that is shipped as part of SQL Server Modeling Services. It facilitates a graphical way of browsing and manipulating data stored in SQL Server 2008 (only 2008) databases. I have a surprise that would will make you very pleased with the ability of this tool, so let's get started.
First you need to download and install the tool. Go to this URL, check to make sure you meet the system requirements and then install this tool.
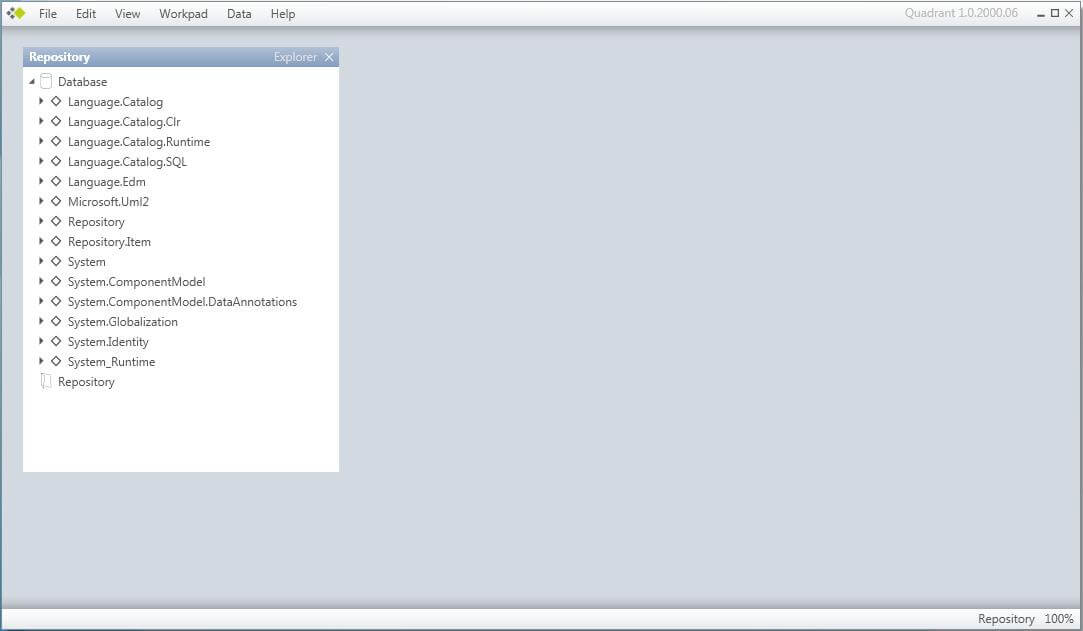
After you install, open the tool and it should look something like the picture below.
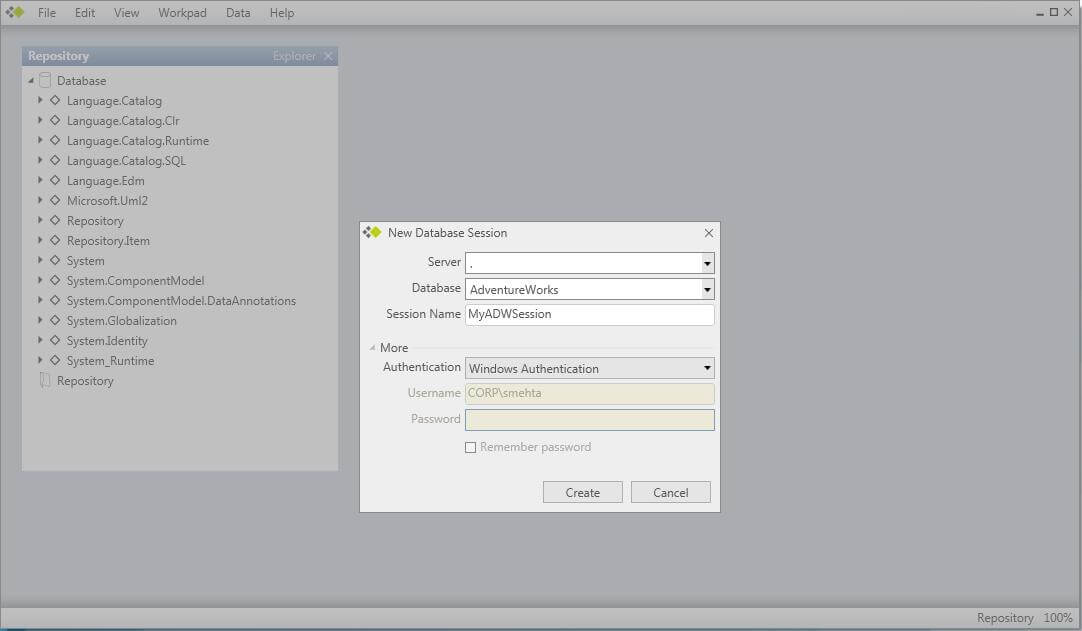
Select New -> Session from the File menu and you should see a dialog box like the one shown in the picture below. I have the AdventureWorks database installed on my machine so let's try to create a connection to this database. After you have successfully created a connection (session) to this database, you should find it listed in the Explorer tab. You will see a tree structure in this tab, with the top nodes as the schemas defined for your database.
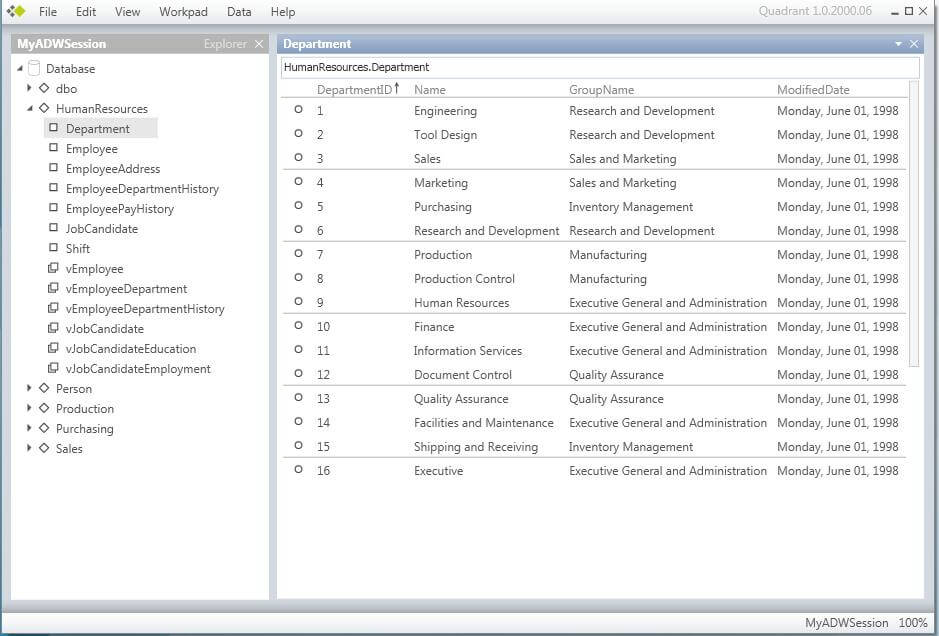
For our walkthrough, we will start with the Department table in the HumanResources schema. Drag and drop the Department table and you should be able to see something like the picture below. I have resized and aligned it to fit my screen.
The new window that you just opened, which shows the data of the Department table, is called a "Workpad". Each workpad has an IE like window and the top bar is the query bar where you can define a query based on "M" language. For example, if you enter "#" beside the table name, it would return the total count of rows in the table you are browsing in the workpad. If you look carefully, you will find an arrow beside the "DepartmentID" column, which (very obviously) shows that the data is sorted based on this ID. Click on any of the column headers and this should sort your data based on that column.
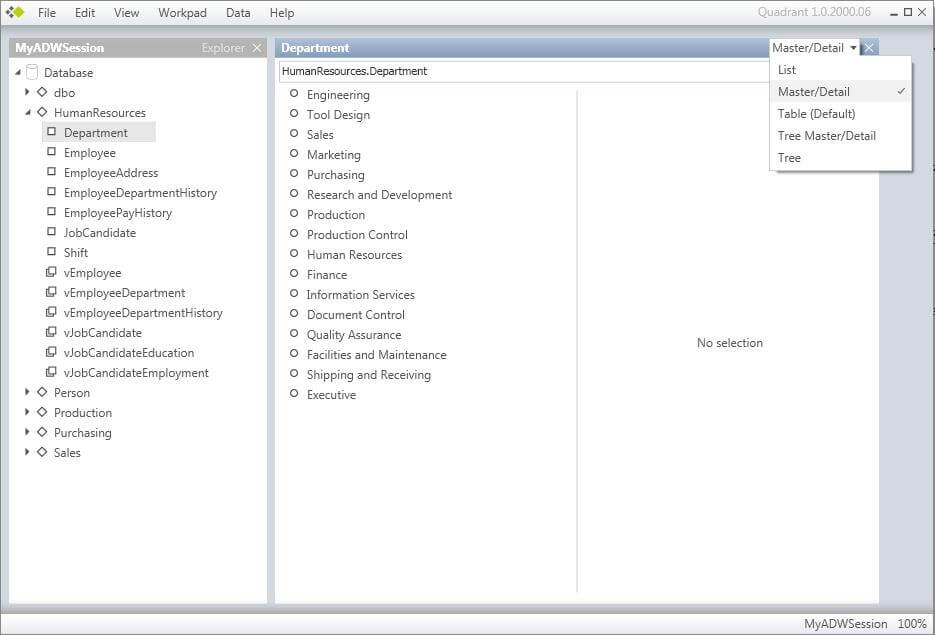
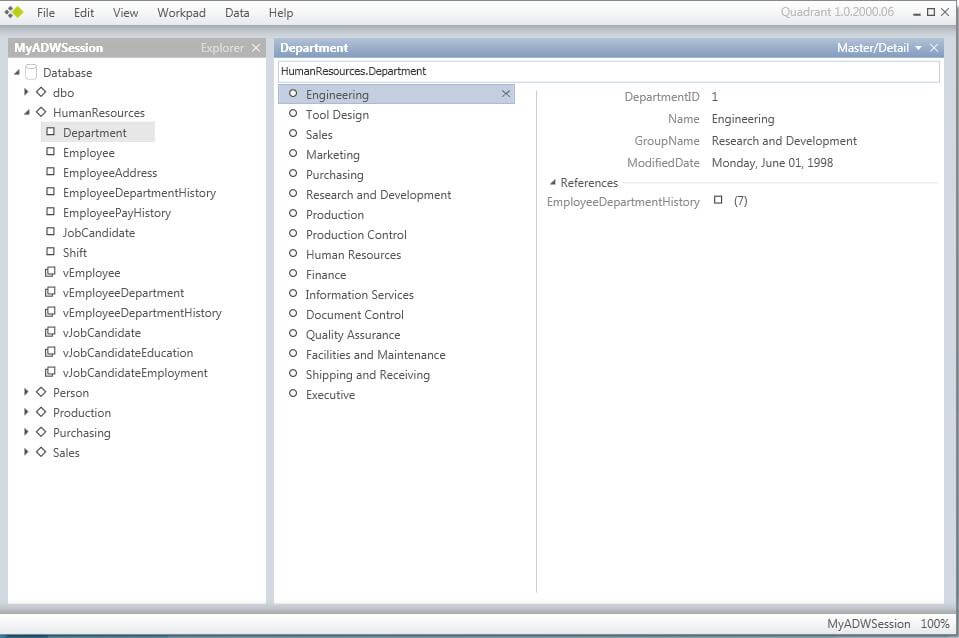
Now click on the arrow adjacent to the close button of the workpad, which gives you the option to select a view to browse your data. Select the Master-Detail view and your workpad will be something like the picture below.
Here comes the interesting part of this tool. Click on the first department visible in your window (I clicked on the Engineering department) and you should be able to see the details of the record and also the records which reference this record. This is shown in the references section below the details of the record from where you can also se that 7 records from EmployeeDepartmentHistory reference this record.
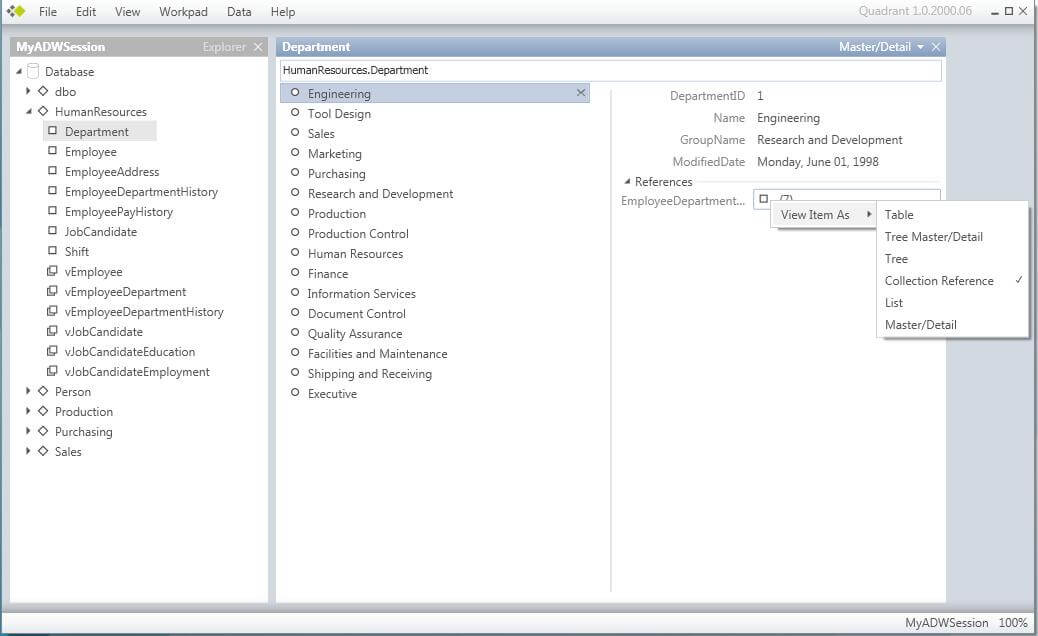
Now I am interested in finding out which records are referencing the "Engineering" department. Click on the box where you see "7" and right-click to change the view of the item and select "Table". After that you should be able to see all the records that reference the Engineering Department.
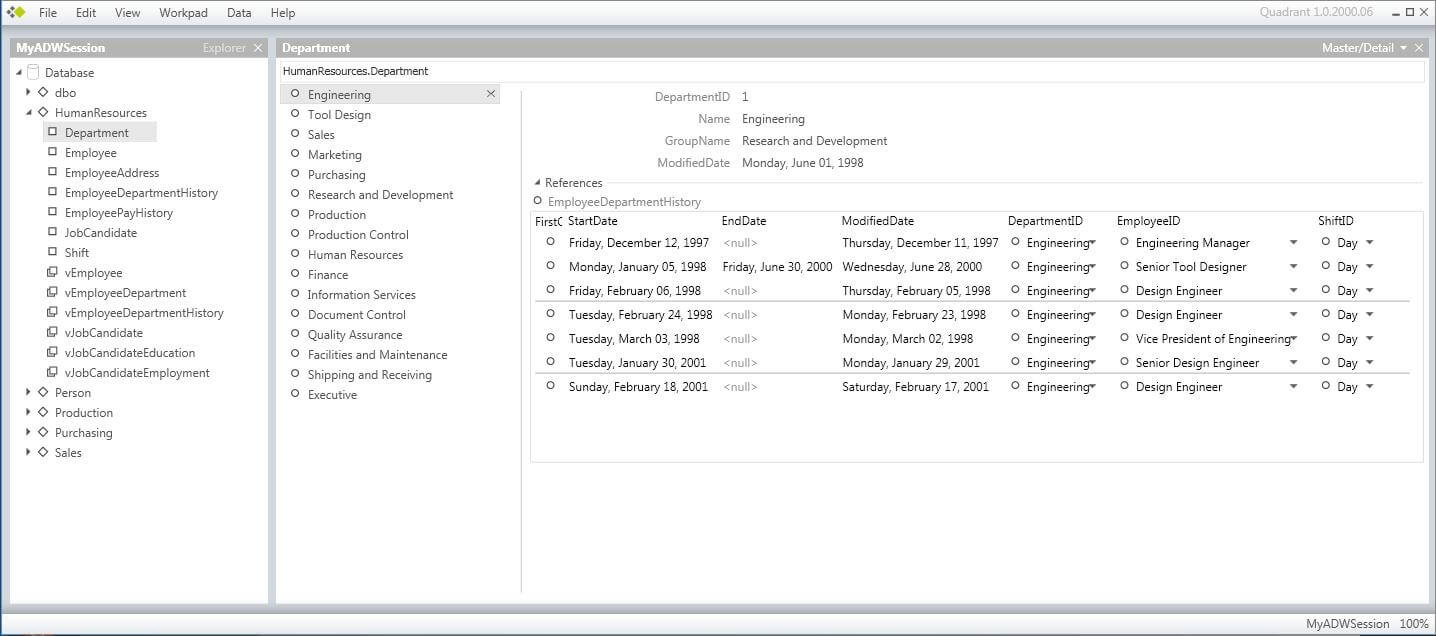
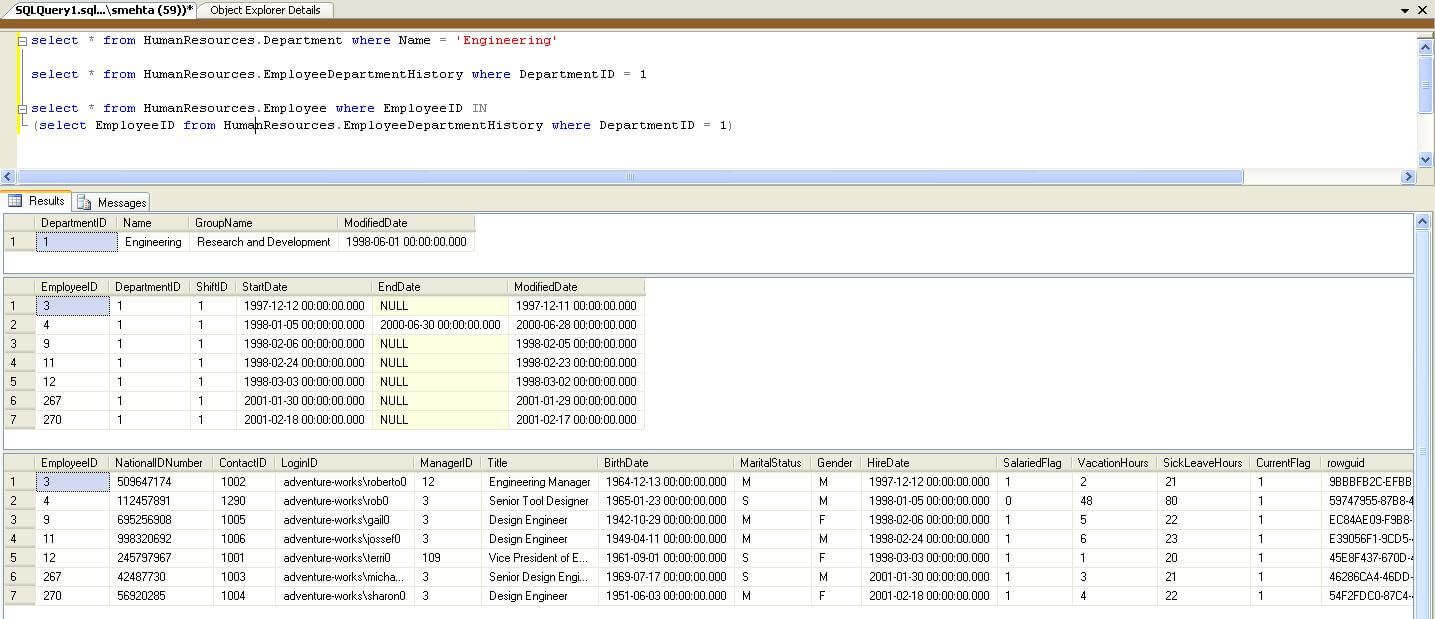
If you carefully watch the results, you will find that under the column headers "DepartmentID", "EmployeeID" and "ShiftID" the values represented are in text. So let's now open SSMS and find out how the data looks in these tables. In the picture below, you can see that even after querying 3 tables, we are not able to view the data in a way that we are able to view using this tool. We can definitely create some stored procedures or views that will allow us to view the data in the way we need, but that would require knowing the inter-relationships among the different database objects and would also consume time and resources in creating them.
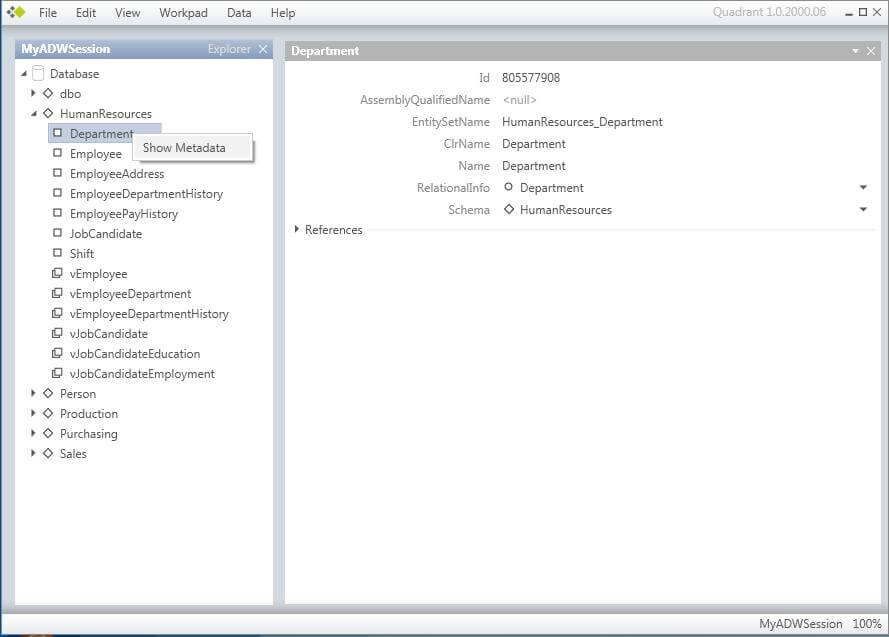
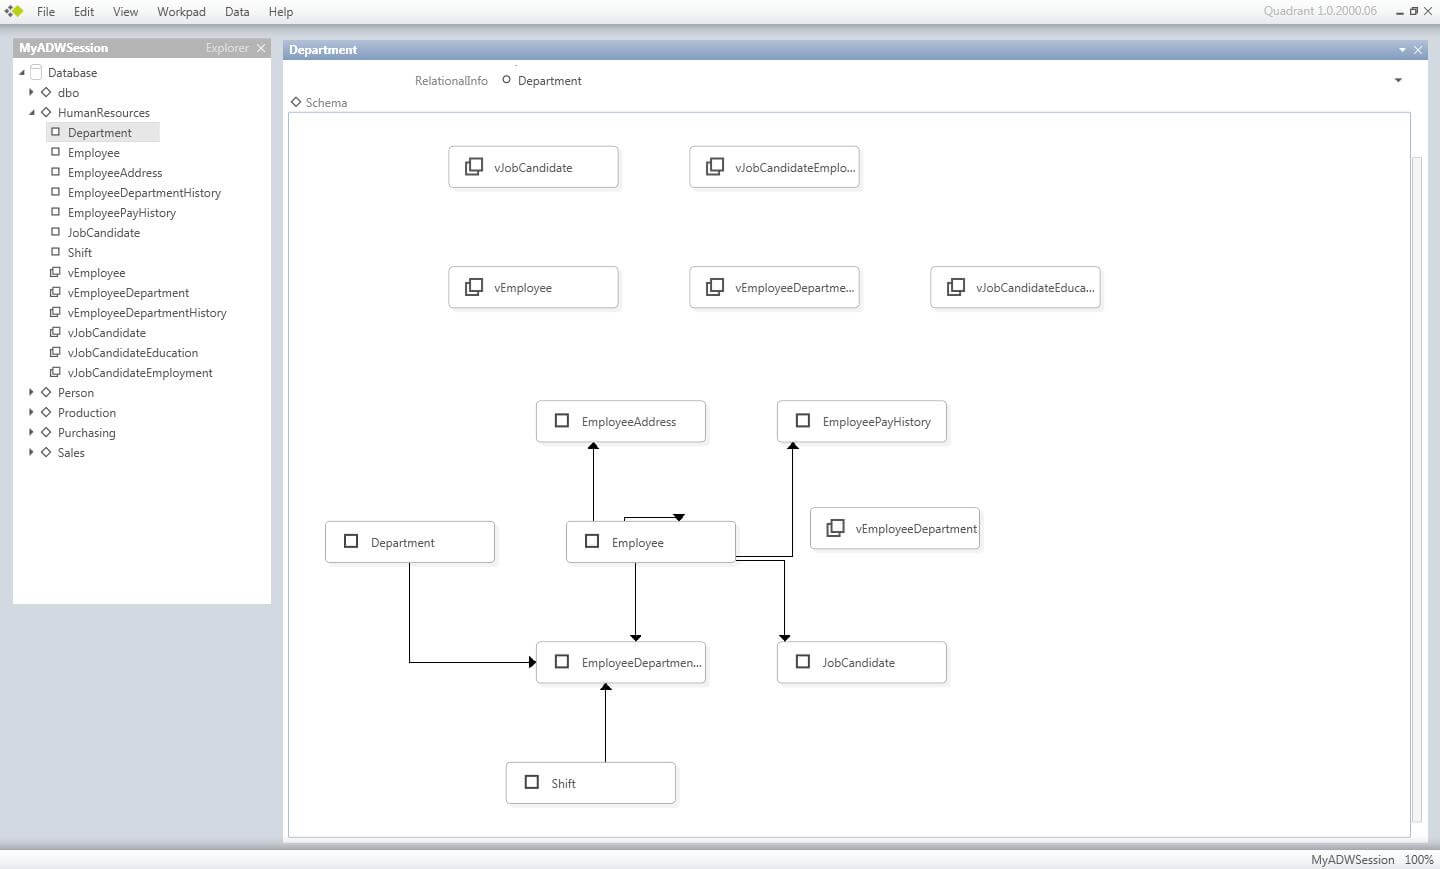
Right-click on the Department table in the Explorer tab and select Show Metadata. Now right-click on the schema box where you find "HumanResources" and select "View Item As" -> "Schema Diagram" and you should be able to see the results as in the below picture. Needless to say, it can help you analyze and model your database by interactively analyzing your data as well as viewing your models in different views that one would need for analysis. Also you can save these views for future reference.
And now it's time for the final surprise. This tool also supports SQL Azure!! So becuase of this, users who may be developers, administrators, end-users or anyone can easily work with SQL Azure in a very interactive way versus any other tool available on the market at least at the time of writing this article (to the best of my knowledge). Not only does this tool allow to view and analyze data, but it also facilitates inserting and updating data in the same interactive manner.This tool is loaded with lots of features and I cannot do enough justice to cover all the features in this single article. Take the time to browse different features of this tool from the video tutorials that you can find here.
I hope that you find a good use for this tool in your existing or future projects.
Next Steps
- Download and install SQL Server Modeling Services Nov CTP - Release 2.
- Try to analyze the dependencies of database objects from your existing applications, as well as the data and model of the same.
- Connect to your SQL Azure account and experiment how this tool works with SQL Azure.
- Also try learning some expressions of "M" language queries, to query your data in the workpad.


About the author
 Siddharth Mehta is an Associate Manager with Accenture in the Avanade Division focusing on Business Intelligence.
This author pledges the content of this article is based on professional experience and not AI generated.
View all my tips
