By: Robert Pearl | Comments (3) | Related: > Performance Tuning
Problem
The Plan Cache plays a significant role in the overall performance of your SQL Server. Cached query plans allow for more efficient operations by saving time and resources. Therefore, if you experience a slow-down of your SQL Server Queries and Stored Procedures, it is extremely important to identify what exactly is in the plan cache, how is the plan cache is currently allocated, and are plans being re-used.
Solution
Let's take a look at some ways we can see inside the cache and to measure various cache statistics as well as plan reuse.
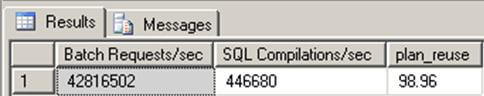
First, before the advent of SQL DMVs, the old (and not entirely great) way to measure plan re-use, was to derive it as a percentage by comparing Batch Requests/sec to SQL compilations/sec. These two performance counters can be calculated where Plan re-use= (Batch Requests - SQL Compilations) / Batch Requests. Here is the script I wrote to derive this data using a DMV.
select t1.cntr_value As [Batch Requests/sec],
    t2.cntr_value As [SQL Compilations/sec],
    plan_reuse =
    convert(decimal(15,2),
    (t1.cntr_value*1.0-t2.cntr_value*1.0)/t1.cntr_value*100)
from
    master.sys.dm_os_performance_counters t1,
    master.sys.dm_os_performance_counters t2
where
    t1.counter_name='Batch Requests/sec' and
    t2.counter_name='SQL Compilations/sec'
Based on the results, as shown below, it was assumed a high percentage number > 90 would indicate the Plan Reuse is high, and thus reduces the amount of server resources required to run the same queries over and over again. Therefore, reusing an existing plan is most optimal.
Fortunately, SQL Server offers up some excellent DMO Views that are more accurate and can help look inside the plan cache, as well as lead us to ways to tune our queries for optimal performance. Here are three scripts that you can use to see what's going on inside the cache, and reveal some useful statistics.
In order to find information about cached query plans, cached query text, the amount of memory taken by cached plans, and the reuse count of the cached plans, you can query the primary DMV sys.dm_exec_cached_plans. For each query plan that is cached by SQL Server, one row is returned.
By looking at the values in the cacheobjtype and objtype columns, we can determine which caching mechanism is being used for each plan in the cache. One of the cacheobjtype values we will focus on here is "compiled plans".
Compiled Plans: Ad-Hoc Queries vs. Stored Procedures
For all queries and stored procedures that are executed for the first time, the SQL Server engine creates an execution plan. It is a new data access plan to retrieve the information from the database. This is also known as a compilation or compile. Compiling a query plan is one of the most expensive operations, thus desirable that the plan already exists in the cache.
If we look only at Compiled Plans, we can compare the values and return a percentage of each object type is in the cache. For example, if we want to compare the number of Ad-Hoc queries in the cache to the number of Stored Procedures, we can run the query I wrote below:
WITH CACHE_STATS AS (
SELECT
cast(SUM(case when Objtype ='Proc' then 1 else 0 end) as DECIMAL (10,2)) as [Proc],
cast(SUM(case when Objtype ='AdHoc' then 1 else 0 end) as DECIMAL (10,2)) as [Adhoc],
cast(SUM(case when Objtype ='Proc'
or Objtype ='AdHoc' then 1 else 0 end)as DECIMAL (10,2)) as [Total]
FROM sys.dm_exec_cached_plans
WHERE cacheobjtype='Compiled Plan'
)
SELECT
cast(Adhoc/Total as decimal (5,2)) * 100 as Adhoc_pct,
cast([Proc] /Total as decimal (5,2)) * 100 as Proc_Pct
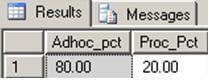
FROM CACHE_STATS cThe result would look similar to this:
Single Use Ad-Hoc Queries in the cache
We can see in the above instance, clearly the Adhoc queries are overwhelmingly residing in cache, as compared to the compiled stored procs. These are queries that may never run again (referred to as single-use), and are wasting space in the cache.
We can further investigate, and look for single-use, ad-hoc queries that are bloating the plan cache. We can do this by running the diagnostic query below (adapted from Glenn A. Berry).
SELECT TOP(50) [text] AS [QueryText], cp.size_in_bytes/1024/1024 as Size_IN_MB
FROM sys.dm_exec_cached_plans AS cp
CROSS APPLY sys.dm_exec_sql_text(plan_handle)
WHERE cp.cacheobjtype = N'Compiled Plan'
AND cp.objtype = N'Adhoc'
AND cp.usecounts = 1
ORDER BY cp.size_in_bytes DESC OPTION (RECOMPILE);
The above query will produce results of the first 50 ad-hoc statements that account for the sizes allocated in the buffer pool, where the plan cache resides.
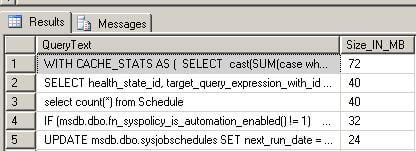
As you can see, the results show which ad-hoc statements are the biggest in size, and thus taking up cache space.
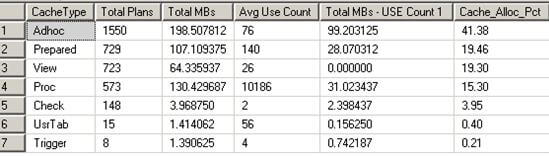
With respect to single-use plans, you can easily see how your entire plan cache is currently allocated, in this modified script, (adapted from Kimberly L. Tripp.) In addition, to some very useful data, I incorporated this query into a CTE, so you can get the allocation percentage of each object type in the cache:
WITH CACHE_ALLOC AS
(
SELECT  objtype AS [CacheType]
        ,COUNT_BIG(objtype) AS [Total Plans]
        , sum(cast(size_in_bytes as decimal(18,2)))/1024/1024 AS [Total MBs]
        , avg(usecounts) AS [Avg Use Count]
        , sum(cast((CASE WHEN usecounts = 1 THEN size_in_bytes ELSE 0 END) as decimal(18,2)))/1024/1024 AS [Total MBs - USE Count 1]
        , CASE
      WHEN (Grouping(objtype)=1) THEN count_big(objtype)
      ELSE 0
      END AS GTOTAL
          FROM sys.dm_exec_cached_plans
GROUP BY objtype
)
   SELECT
      [CacheType], [Total Plans],[Total MBs],
      [Avg Use Count],[Total MBs - USE Count 1],
      Cast([Total Plans]*1.0/Sum([Total Plans])OVER() * 100.0 AS DECIMAL(5, 2)) As Cache_Alloc_Pct
      FROM CACHE_ALLOC
      Order by [Total Plans] desc
Results will appear as below:
Summary
In this article, I only scratched the surface on talking about the Plan Cache, and focused on some diagnostic scripts that let you peek inside the plan cache, and help identify how your cache is being used by SQL Server. In future tips, I will talk more about how the plan cache works, and ways to actually enhance cache performance. In the meanwhile, these scripts will allow you to analyze some cache statistics.
Next Steps
- Here are some other ways to Analyzing SQL Server Plan Cache Performance Using DMVs, in a previous tip by Tim Ford
- You can view the latest technical information on the sys.dm_exec_cached_plans DMV
- Some in-depth technical discussion of Plan Caching in SQL Server 2008 on MS Technet


About the author
 Robert Pearl is a SQL MVP, and President of Pearl Knowledge Solutions, Inc., offering SQLCentric monitoring and DBA services.
This author pledges the content of this article is based on professional experience and not AI generated.
View all my tips
