By: Arshad Ali | Comments (3) | Related: > Reporting Services Overview
Problem
When we are done creating a SSAS cube we often think of whether to use SSRS (SQL Server Reporting Services) or PPS (PerformancePoint Services) for the reporting UI. The question is what are the pros and cons of each of these approaches and in what scenario should one be chosen over the other or can they be used together to compliment each other?
Solution
Which one should you choose? Before we get to that, let's cover a brief summary of each tool.
SQL Server Reporting Services
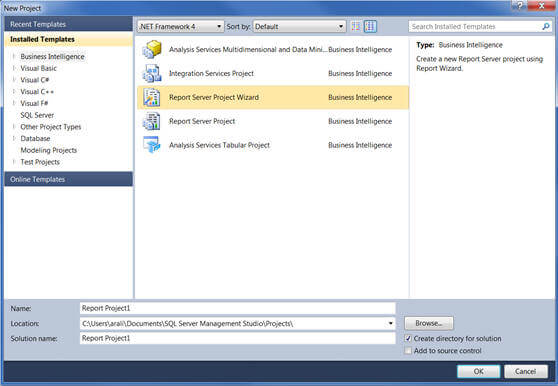
SQL Server Reporting Services (SSRS) is a component/feature of SQL Server which allows us to design, develop, test, deploy and manage reports. SSRS allows to create interactive, tabular, graphical, or free-form reports from heterogeneous data sources like relational, multidimensional, XML-based data sources, etc. with rich data visualization like charts, maps, and spark lines. A report created in SSRS can be exported in varieties of different formats like Microsoft Excel, Microsoft Word, PDF, etc. Other features like report caching and report subscriptions can be used for better report performance. SSRS, being a part of SQL Server, can be installed/configured on the same machine as SQL Server or can be installed/configured on another machine than SQL Server (or can be deployed in a farm environment for better scalability). The report developer normally uses Business Intelligence Development Studio or BIDS in SQL Server 2005/2008/2008R2 and SQL Server Data Tools or SSDT in SQL Server 2012 for creating SSRS reports by choosing either of the two templates available for SSRS report projects as shown below. Though some power users can use the Report Builder tool as well to create SSRS reports in an adhoc manner. To learn more about SSRS, click here.
PerformancePoint Services
PerformancePoint Services (PPS), now a service in SharePoint 2010 enterprise edition, is a service application to easily build dashboard, scorecards and Key Performance Indicators (KPIs) for monitoring and analyzing business data in an interactive and more intuitive manner. To learn more about PerformancePoint Services, click here and for related tips click here.
Though the step by step guide of creating dashboards in PPS is out of scope for this tip, I will briefly talk about how someone can start working with it. A developer, first of all, needs to create a SharePoint site collection using the Business Intelligence Center template; once the site collection is created it will look similar to below:
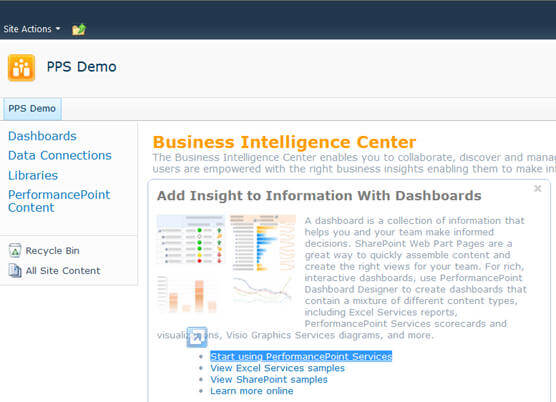
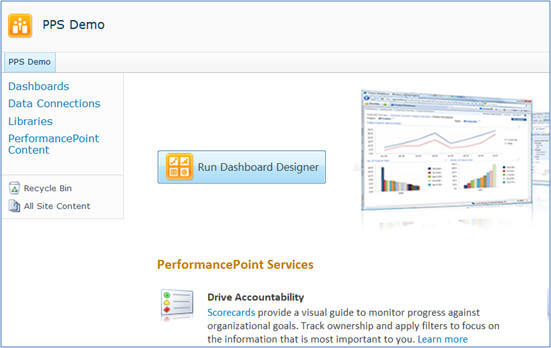
You can click on "Start using PerformancePoint Service" link, as shown above, on the site which will take you to a page, as shown below, where you need to click on the Run Dashboard Designer button to launch PerformancePoint Dashboard Designer:
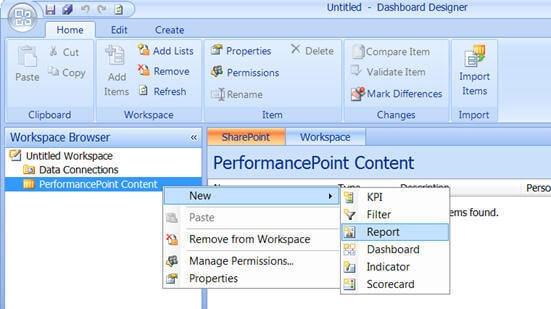
PerformancePoint Dashboard Designer is a tool which is used by dashboard designer to create dashboards and embed KPIs, filters, reports, charts etc.
One important point to note is that a PPS dashboard can contain/embed SSRS reports, but the reverse is not true.
Pros and Cons
SQL Services Reporting Services - SSRS
- Pros
- Flexibility in defining specific formatting and layout, specific item placement, multiple or composite report items, groups, headers, footers, subtotals
- Report caching and snapshot for better performance especially if the source data query is complex and takes longer to execute
- Creating report subscription for automatic report delivery via email or file share mode
- Can combine multiple data sources (relational and OLAP data) into a single report
- Additional charting options - map, area, range, scatter, polar, 3D, sparklines, data bars, etc
- As similar as PPS dashboard, SSRS reports can also be deployed on a SharePoint site for collaboration
- Cons
- Harder to create dashboards and therefore often done by IT people
- No automatic drill-through and drill-across features
PerformancePoint Services - PPS
- Pros
- Unique decomposition tree feature for better and multi-level data analysis; you can refer to this tip for more on decomposition tree feature.
- Automatic drill-through and drill-across features using the decomposition tree on SSAS cube
- Stunning/great appearance of dashboard, score cards, etc.
- Scorecards allow users to enter comments against KPI values
- Usually less development time required in comparison with SSRS reports or dashboard
- Cons
- Comes with SharePoint 2010 Enterprise Edition
- Limited flexibility in defining formatting and layout; cannot be customized or modified as much as SSRS
Summary
To summarize, both of these tools and technologies have a minimal learning curve and someone can easily start working with them. PerformancePoint Services, in SharePoint 2010 Enterprise Edition, allows you to get some stunning looking KPIs Scorecards up and running much quicker. However, PerformancePoint Services is more restrictive than SQL Server Reporting Services in terms of customization and hence SQL Server Reporting Services is the better choice if your dashboard/KPI requirements are complex in terms of layout or formatting. Though in many implementations a combination of both are used; a complex report is developed in SSRS and then embedded as part of PPS dashboard for better appearance and as a part of collection of information for better analysis.
Next Steps
- Review SQL Server Reporting Services tutorial tips.
- Review PerformancePoint Services overview on msdn.
- Review Features Supported by the Editions of SQL Server 2012 on msdn.


About the author
 Arshad Ali is a SQL and BI Developer focusing on Data Warehousing projects for Microsoft.
This author pledges the content of this article is based on professional experience and not AI generated.
View all my tips
