By: Arshad Ali | Comments (11) | Related: > Analysis Services Administration
Problem
SQL Server 2012 introduced an unified BI Semantic Model (BISM) which is based on some of the existing as well as some new technologies. This model is intended to serve as one model for all end user experiences for reporting, analytics, scorecards, dashboards, etc. In this tip, I will talk in detail about the new BISM, how it differs from the earlier Unified Dimensional Model (UDM) and how BISM lays down a foundation for future.
Solution
SQL Server 2005 and 2008 had the Unified Dimensional Model (UDM) for creating OLAP and data mining solutions. SQL Server 2008 R2 introduced the VertiPaq engine for storing data in a highly compressed format in memory at runtime. This technology improved the performance of analysis significantly faster in Excel with PowerPivot. Further, PowerPivot could be deployed to SharePoint for collaboration and to convert personal Business Intelligence (BI) solutions to team/organization BI. SQL Server 2012, has introduced an unified Business Intelligence Semantic Model (BISM) which is based on some of the existing as well as some new technologies. This model is intended to act as one model for all end user experiences for reporting, analytics, scorecards, dashboards, etc. whether it is personal BI, team BI or organizational BI.
SQL Server Analysis Services Vision
SQL Server Analysis Services has became a market leader due to its performance, scalability, accessibility, reduced total cost of ownership and relative ease of solution development. Analysis Services in SQL Server 2012 has broadened its capabilities, features, ease of development and scope of reach even further. To define the vision for this next generation product release, the Analysis Services product group has decided on a set of key guiding principles for broader adoption:
- Build a BI platform based on the strengths and successes of Analysis Services and expand its reach to a much broader user base
- Bring together the relational and multidimensional models/projects under a single unified BI platform - best of both worlds together under an unified BI Semantic Model platform
- Embrace the relational data model - which is easily, well and widely understood by developers and IT Pros around the world
- Provide flexibility in the platform to suit the diverse needs of BI applications
- Continue to make use of its rich existing ecosystem of tools, developers, their skillset and partners for ease of development
Business Intelligence Semantic Model (BISM)
The Business Intelligence Semantic Model (BISM) is a single unified BI platform which has both multi-dimensional as well as tabular data modeling capabilities to offer best of both worlds and choice for the developer. As we all agree, the relational data model is relatively easier to understand and used by a larger group of developers than multi-dimensional models, hence it makes sense to embrace the relational/tabular data modeling for broader adoption and to ensure utilization of customers' existing investments and skill available with them.
The model based on BISM can integrate data from heterogeneous data source including traditional data sources like relational databases, LOB applications or un-traditional sources like data feeds, text files, Excel, cloud services, etc. and users can work with the data stored in the model in all of these ways regardless of how the model (whether it's multi-dimensional or tabular) was developed. Having said that, the BI Semantic Model is the one model that powers all end-user experiences and can be accessed in an intuitive way using Reporting Services, Power View, PowerPivot, Excel, SharePoint, etc.
Any model based on BISM can be conceptually divided in three layers: Data Model, Business Logic and Queries and Data Access as described below.
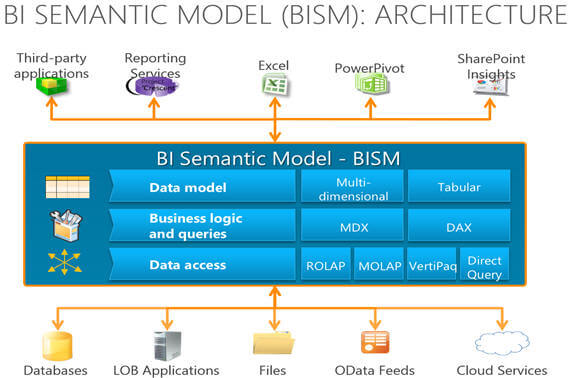
Data Model - BI Semantic Model developers can choose between multi-dimensional or tabular projects based on the needs of their application, their skill set and the client tool can consume the model using a multi-dimensional or a tabular interface.
- Multi-dimensional - BI Semantic Model allows traditional ways of creating multi-dimensional model; it allows creating a model with a cube and dimensions normally based on dimensional data model/star-snowflake schemas of a relational data warehouse.
- Tabular - BI Semantic Model also allows creating a model based on relational data sources and makes the development much easier as it is easier to understand.
Business Logic and Queries - Again, BI Semantic Model developers and client tools can choose between MDX and DAX based on application needs, skill set, user experience, etc.
- MDX - MDX (Multi Dimensional Expression) was introduced with Analysis Services long back and now has become the de-facto BI industry standard for multi-dimensional business logic, calculations and queries for OLAP.
- DAX - DAX (Data Analysis Expression) is an expression language based on Excel formulas that was introduced initially with PowerPivot and is built on tabular concepts (tables, columns, and relationships). DAX can be used to support model development (like creating calculated columns, measures, and KPIs for tabular models and PowerPivot models), relationship navigation, context modification and time intelligence.
Data Access - The Data Access layer integrates data from heterogeneous data sources; there are basically two modes for data retrieval and management as discussed below. Though there is a tradeoff between the two modes and the BI Semantic Model developer needs to make the choice based on application needs, local data storage requirements and data latency.
- Cached - Cached data mode retrieves data from all the sources and stores it in a compressed data structure that is optimized for high speed data access. MOLAP is the storage format that has been used in Analysis Services cube (for multi-dimensional model) for many releases of Analysis Services. It is optimized for OLAP and uses techniques such as pre-built aggregates, bitmap indexes, and high degree of compression to deliver great performance and scale. Whereas VertiPaq is an in-memory column store engine (for tabular model) that combines state-of-art data compression and scanning algorithms to deliver blazing fast performance with no need for indexes, pre-calculated aggregates or tuning.
- Pass-through - Pass-through mode pushes query processing and business logic down to the underlying data sources, thereby exploiting the capabilities of the source system and avoiding the need to copy the data as part of the model. ROLAP is complementary to MOLAP of multi-dimensional model whereas DirectQuery is complementary to VertiPaq of tabular data model. Both attempt to push query evaluation, as much as possible, down into the underlying data sources. ROLAP is optimized for large fact tables and relatively small dimension tables (star schema), while DirectQuery is mostly neutral towards the backend database structure though in SQL Server 2012, DirectQuery is supported only for models that are based on a single SQL Server relational data source.
Analysis Services Deployment Mode
Now with SQL Server 2012, an installation of Analysis Services can be done either in multi-dimensional, tabular or PowerPivot for SharePoint mode. As discussed above each of these deployment modes uses a different engine (Analysis Services engine for multi-dimensional whereas VertiPaq engine for tabular or PowerPivot for SharePoint) and works differently by using different storage structure and memory architecture. Each Analysis deployment mode supports different set of data sources, development/management tools, query language, etc.
Check out this table outlining all of the details.
| Feature | Multidimensional Modeling | Tabular Modeling | PowerPivot for SharePoint |
| Data Sources | Relational databases | Relational databases, Analysis Services cubes, Reporting Services reports, Azure DataMarket datasets, data feed, Excel files and text files | Relational databases, Analysis Services cubes, Reporting Services reports, Azure DataMarket datasets, data feed Excel files and text file |
| Development Tool | SQL Server Data Tools (SSDT) | SQL Server Data Tools (SSDT) | PowerPivot for Excel |
| Management Tool | SQL Server Management Studio (SSMS) |
SQL Server Management Studio (SSMS) |
SharePoint Central Administration PowerPivot Configuration Tool |
| Application Programming Interface | AMO, AMOMD.NET and PowerShell | AMO, AMOMD.NET and PowerShell | No support |
| Reporting and Analysis Tool | Report Builder, Report Designer, Excel PivotTable and PerformancePoint dashboard |
Report Builder, Report Designer Excel PivotTable, PerformancePoint dashboard and Power View |
Report Builder, Report Designer, Excel PivotTable, PerformancePoint dashboard and Power View |
| Query and Expression Language DAX - Data Analysis Expression MDX - Multi Dimensional Expression DMX - Data Mining Expression |
MDX for calculations and OLAP queries DMX for data-mining queries |
DAX for calculations and queries MDX for queries |
DAX for calculations and queries MDX for queries |
| Write-back Support | Yes | No | No |
| Security | Role-based permissions in SSAS and cell-level security | Role-based permissions in SSAS and row-level security | File-level security using SharePoint permissions |
| Data Compression Ratio | 3+ times | 10+ times | 10+ times |
During the installation of Analysis Services, on the Setup Role page of the SQL Server Setup, you need to select the SQL Server Feature Installation option for Multi-dimensional and Data Mining or Tabular mode, or PowerPivot For SharePoint option. Once you are done with the installation of Analysis Services, you cannot change the deployment mode of an existing Analysis Services instance (from multi-dimensional to tabular or vice-versa). Though multiple instances of Analysis Services can co-exist on the same server, each running a different deployment mode.
Why the BI Semantic Model? Why Microsoft BI Stack?
First, the BI Semantic Model is a highly performing and scalable. The performance and scalability comes from the MOLAP and VertiPaq storage engines that enable data volumes all the way from a few megabytes up to multiple terabytes. MOLAP used bitmap index, pre-calculated aggregates in compressed formant for high performance whereas VertiPaq uses in-memory column store engine that combines high compression and scanning algorithms to deliver blazing fast performance with no need for indexes, pre-calculated aggregates or tuning.
Second, the BI Semantic Model is feature rich. The value lies in the sophisticated data modeling capabilities and complex business logic that can be expressed using MDX and DAX languages.
Third, the BI Semantic Model offers flexible modeling capabilities. In other words, Model developers can choose between the multi-dimensional or tabular data modeling based on their experience and skill-set, between MDX and DAX for business logic, and between cached and pass-through modes for data access, data latency and storage. Regardless of the model developer's choices, client tools see a single model and can consume it using the multidimensional or tabular interfaces and send MDX or DAX queries for accessing the model.
In this tip, I talked in detail about new BISM, its architecture, how it differs from earlier UDM and how BISM lays down a foundation for future. In the next tip I am going to talk in detail about differences between multi-dimensional model vs. tabular model, when to choose one model on another and step by step guide on creating tabular model project, please stay tuned.
Next Steps
- Review Analysis Services - Roadmap for SQL Server Code Name "Denali" and Beyond.
- Review Comparing Tabular and Multidimensional Solutions (SSAS).
- Review SQL Server 2012 tips.
- Review my previous tips.


About the author
 Arshad Ali is a SQL and BI Developer focusing on Data Warehousing projects for Microsoft.
This author pledges the content of this article is based on professional experience and not AI generated.
View all my tips
