By: Susantha Bathige | Comments (8) | Related: > Replication
Problem
I have several clustered SQL Server 2012 instances installed and I am having
issues with replication latency.
The environment has a dedicated SQL Server instance for the distributor. One
instance has publisher database(s) and another instance has subscriber
database(s). It is reported that there is high latency in replication most of the time. I
also noticed that there is a lot of blocking on the distribution server with big CPU spikes.
Solution
Fixing latency issues is not a straightforward process. You need to gather a lot of data, analyze the data, make changes one at a time and then monitor to see if you have fixed the issue. This is a continuous process until you get acceptable latency.
Understanding Data Flow in SQL Server Transactional Replication
Before we begin, it will help to understand the data flow of SQL Server transactional replication.
There are three main components:
- Publisher - the database/server which needs to replicate data
- Distributor - the database/server which stores the
replicated data temporarily
- Subscriber - the destination database/server which
consumes the replicated data
Typically in a high use OLTP system, each component is a dedicated SQL Server to support high availability.
Figure 1 shows the architecture of transactional replication.
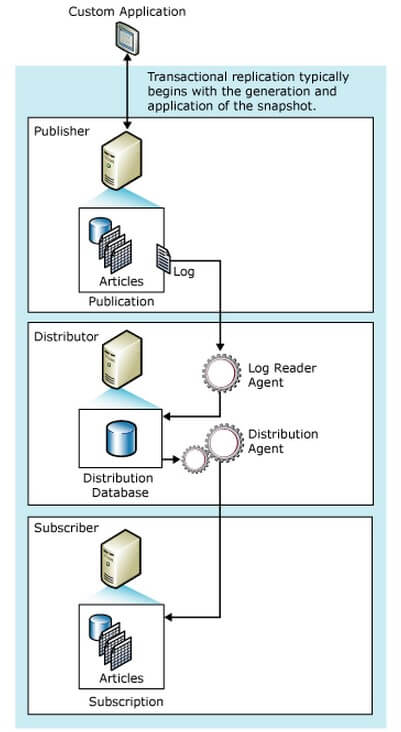
Figure 1 - Replication Architecture (BOL:
http://msdn.microsoft.com/en-us/library/ms151176.aspx
Monitoring SQL Server Transactional Replication
It is necessary to implement a latency report to monitor and alert if latency is above a certain threshold
that you define. It could be 5 minutes, 10 minutes
or even a few seconds depending on your environment and service level agreement
(SLA)
with the users. This is really important when troubleshooting latency issues.
The latency report should have information about the total latency, latency
between publisher and distributor, latency between distributor and subscriber
therefore you will know exactly which part of replication has issues.
Tracer tokens are commonly used to measure latency. You can use Replication Monitor (RM) to insert a tracer token for each publication. Alternatively you could use T-SQL commands as well.
Fore more details about tracer tokens refer to this, BOL: http://technet.microsoft.com/en-us/library/ms151846(v=sql.105).aspx
How To Get Replication Latency
The following is output from sp_replcounters for a good performing environment.
| database | replicated transactions | replication rate trans/sec | replication latency (sec) | replbeginlsn | replnextlsn |
|---|---|---|---|---|---|
| Publisher_db1 | 2587 | 1946.951 | 0.04 | 0x0008C11A00316D090001 | 0x0008C11A00316D090004 |
| Publisher_db1 | 0 | 562.5 | 1.883 | 0x00000000000000000000 | 0x00000000000000000000 |
Table 1 - Sample output of sp_replcounters
- Database - publisher database
- Replicated transactions - Number of transactions in the log awaiting delivery to the distribution database
- Replication rate trans/sec - Average number of transactions per second delivered to the distribution database
- Replication latency - Average time, in seconds, that transactions were in the log before being distributed
- Replbeginlsn - Log sequence number (LSN) of the current truncation point in the log
- Replendlsn - LSN of the next commit record awaiting delivery to the distribution database
Using the above information you can determine how good the overall replication latency is. The higher the value you see in "replication transactions rate/sec" the better the data transfer speed for replication. Also having low numbers for the "replication latency (sec)" column.
Sample output of poorly performing replication system is shown in Table 2.
| database | replicated transactions | replication rate trans/sec | replication latency (sec) | replbeginlsn | replnextlsn |
|---|---|---|---|---|---|
| Publisher_db1 | 11170556 | 1612.123 | 9232.216 | 0x000998C5006A0E6C0021 | 0x000998C5006A1C720004 |
Table 2 - Output of sp_replcounter against poorly performing replication system
In this situation, you can see latency is over 2.5 hours (refer replication latency column 9232 seconds). At the same time you can see the data transfer rate is fairly good (1612.123). So what may be the problem? See the replicated transactions, it is more than 11 million, meaning there are over 11 million commands waiting to be delivered to the distribution database. In other words, they are still in the Transaction Log (T-Log) of the publisher database. So in this particular case, the latency is mainly between the publisher and the distributor. If you configured the latency report, it would show a high value of latency between the publisher and distributor.
If you see strange high figures like above (Table 2), this could be due to following reasons:
- large transactions occurred in publisher database
- slow performing network
- slow performing storage
If you see millions of waiting commands in the output and you figured it is not due to a slow network, slow storage or unexpected OLTP operations at the publisher, then the issue is probably with the configuration of T-Log of the publisher database.
Remember replication is one of the log based operations in SQL Server. So the configuration of the t-log for the publisher database closely relates to the performance of replication. The program called, Log Reader scans the t-log to identify the commands to be replicated (Refer Figure 1). So in this case, you need to pay attention to the t-log size, whether it is properly sized according to the transaction volume of the publisher, the number of VLFs of the T-Log and the size of VLFs. For replication, all these parameters matter. It is quite challenging to identify the "sweet spot" of the t-log in terms of number of VLFs. The below links might be helpful.
- https://www.mssqltips.com/sqlservertip/1225/how-to-determine-sql-server-database-transaction-log-usage/
- http://www.sqlskills.com/blogs/kimberly/transaction-log-vlfs-too-many-or-too-few/
SQL Server Log Reader Agent
Log reader is an executable which executes from the distributor and scans the T-Log of the publisher database. There are two threads that do the work:
- Reader Thread - Reads the T-Log via the stored procedure, sp_replcmds. This scans the T-Log and identifies the commands to be replicated by skipping not-to-be replicated commands.
- Writer Thread - Writes the transactions identified by the reader thread into the distribution database via sp_MSadd_replcmds.
Both of these stored procedures are system stored procedures that are created when you configure transactional replication. There are parameters for the log reader agent profile which you can use to change the behavior of the Log Reader thus you can change replication behavior. Taking a closer look at parameter values for the Log Reader is an essential part of troubleshooting replication issues including latency.
Fore more details: BOL: http://msdn.microsoft.com/en-us/library/ms146878.aspx
How To View Log Reader Agent Profile
In SSMS, connect to the distribution server. Right click on Replication and click on Properties. (Refer Figure 2 and 3)
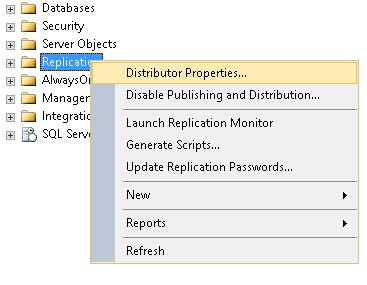
Figure 2 - Get distributor properties
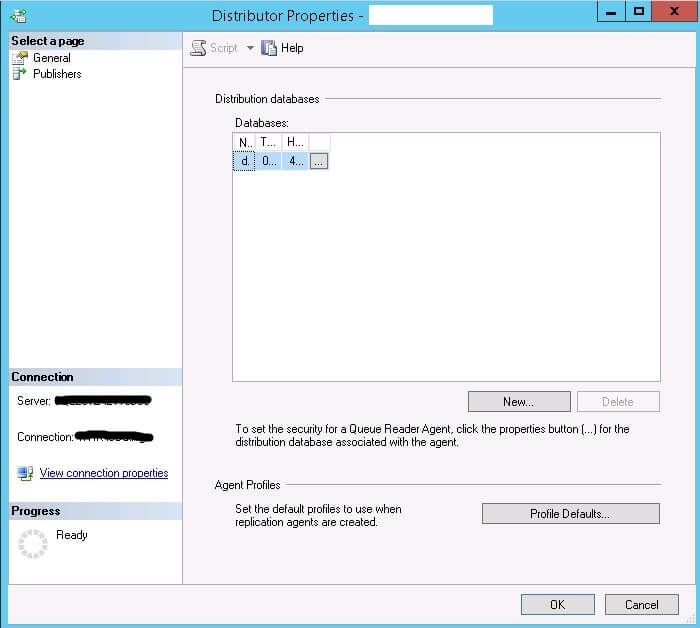
Figure 3 - Distributor properties
Click on Profile Defaults in the Distributor Properties window shown in Figure 3. The Agent Profiles window displays as shown in Figure 4.
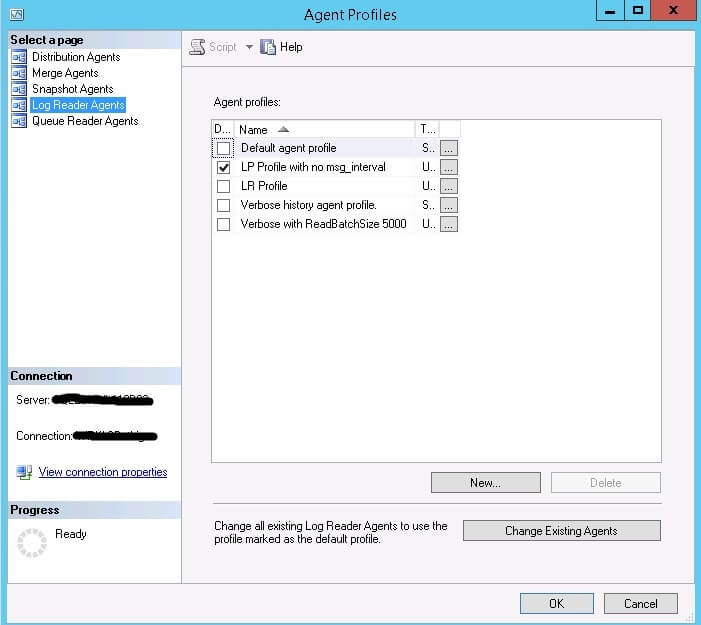
Figure 4 - Agent Profiles
The right pane of the Agent Profiles window has all the replication agent profiles. Select Log Reader Agents from the list and you will see the profiles for the Log Reader. The ticked one is currently be used and you can click on … to get the configuration values for the Log Reader Agent Profile as shown in Figure 5 below.
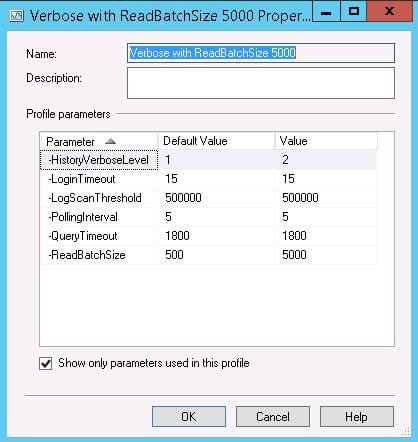
Figure 5 - Profile Parameters
Note: When you change the Log Reader properties they will not take effect until you restart SQL Server Agent.
Important Parameters of Log Reader Agent Profile
There are certain parameters that you need to adjust as part of fine tuning process of transactional replication system.
- -Continuous - Specifies whether the agent tries to poll replicated transactions continually. If specified, the agent polls replicated transactions from the source at polling intervals even if there are no transactions pending.
- -HistoryVerboseLevel [ 0| 1| 2] - Specifies the amount of history logged during a log reader operation. You can minimize the performance effect of history logging by selecting 1.
- -MaxCmdsInTran - Specifies the maximum number of statements grouped into a transaction as the Log Reader writes commands to the distribution database. Using this parameter allows the Log Reader Agent and Distribution Agent to divide large transactions (consisting of many commands) at the Publisher into several smaller transactions when applied at the Subscriber. Specifying this parameter can reduce contention at the Distributor and reduce latency between the Publisher and Subscriber. Because the original transaction is applied in smaller units, the Subscriber can access rows of a large logical Publisher transaction prior to the end of the original transaction, breaking strict transactional atomicity. The default is 0, which preserves the transaction boundaries of the Publisher.
- -PollingInterval - Is how often, in seconds, the log is queried for replicated transactions. The default is 5 seconds.
- -ReadBatchSize - Is the maximum number of transactions read out of the transaction log of the publishing database per processing cycle, with a default of 500. The agent will continue to read transactions in batches until all transactions are read from the log. This parameter is not supported for Oracle Publishers.
- -ReadBatchThreshold - Is the number of replication commands to be read from the transaction log before being issued to the Subscriber by the Distribution Agent. The default is 0. If this parameter is not specified, the Log Reader Agent will read to the end of the log or to the number specified in -ReadBatchSize (number of transactions).
How To Decide The Log Reader Agent Profile Settings
You can query the MSLogreader_history table in the distribution database to see the log reader statistics. By analyzing these data, you can determine the performance of the log reader. You can use the below query;
USE distribution
GO

SELECT time,
CAST(comments AS XML) AS comments,
runstatus,
duration,
xact_seqno,
delivered_transactions,
delivered_commands,
average_commands,
delivery_time,
delivery_rate,
delivery_latency / ( 1000 * 60 ) AS delivery_latency_Min
FROM mslogreader_history WITH (nolock)
WHERE time > '2014-10-28 16:00:00.130'
ORDER BY time DESC
It is difficult to attach a sample output, because the output is very wide. However I would like to highlight some of the columns.
Look at the values in the Comments column below. It contains xml segments which have valuable information. The Comments column gives you information about how the Log Reader is performing. The below table shows six different sample records of actual data in a replication environment. Look at rows 2, 3 and 6. It displays more information with state 1, 2 and 3 messages.
If you see a lot of messages like "Approximately 2500000 log records have been scanned in pass # 4, 0 of which were marked for replication." which means, the Log Reader Agent has found 0 records to replicate. This essentially means there are many operations going on in publisher which are not marked for replication. Increasing the -ReadBatchSize parameter would be beneficial in this type of situation. The default value of the parameter is 500, but you could increase this value by several thousand to scan more t-log records because most of the time you do not find much data to replicate.
| Seq# | Comments |
|---|---|
| 1 | 12 transaction(s) with 14 command(s) were delivered. |
| 2 | No replicated transactions are available. |
| 3 |
|
| 4 |
|
| 5 | Approximately 2500000 log records have been scanned in pass # 4, 0 of which were marked for replication. |
| 6 |
|
See below for what these state values mean:
- state 1 - Normal activity. Nothing to worry about
- state 2 - Reader Thread has to WAIT for Writer Thread. Has some issues
- state 3 - Writer Thread has to WAIT for Reader Thread. Has some issues
Using these messages you can nail down your analysis of Log Reader Agent performance to Reader or Writer Thread issues. Another important data column you need to know is "xact_seqno", which is the last processed transaction sequence number. Look at that value and see it is changing frequently. If so, replicated commands are processing quickly. Sometimes you may see the same value in xact_seqno column for a long time, maybe even for a few hours. That indicates a large transaction occurred in the publisher database which resulted in large DML activities. You can identify the actual commands of the transaction using the below code snippet.
USE distribution
go
EXEC Sp_browsereplcmds
@xact_seqno_start = '0x0008BF0F008A6D7F00AA',
@xact_seqno_end = '0x0008BF0F008A6D7F00AA',
@publisher_database_id = 10
@publisher_database_id may be different than the database id of the publisher server. You need to know that first before executing the above code. Use the below code to identify the publisher_database_id.
USE distribution
GO

SELECT * FROM dbo.MSpublisher_databases
Or
USE distribution
go
SELECT TOP 1 publisher_database_id
FROM msrepl_commands
WHERE xact_seqno = '0x0008BF0F008A6D7F00AA'
Note: This publisher database id is different from the database id of sys.databases in publisher server.
Refer to the command column of sp_browsereplcmds query to see the actual command executing. This way you can get a better sense of what is happening at the moment when there is a slowness in replication.
If the transaction has millions of DML activities, it takes time to run the sp_browsereplcmds query. Additionally you can filter the records using @article_id or @command_id or both as below;
USE distribution
go
EXEC Sp_browsereplcmds
@xact_seqno_start = '0x0008BF0F008A6D7F00AA',
@xact_seqno_end = '0x0008BF0F008A6D7F00AA',
@publisher_database_id = 10,
@article_id = 1335,
@command_id= '1000000'
How Large are the Replication Specific Tables
The distribution database has many tables to support SQL Server replication. It is important to know how big they are. At least the most important ones. This should be a part of your troubleshooting effort. I normally use the below query to see the record count of the most centric tables for transactional replication.
USE distribution
GO
SELECT Getdate() AS CaptureTime,
Object_name(t.object_id) AS TableName,
st.row_count,
s.NAME
FROM sys.dm_db_partition_stats st WITH (nolock)
INNER JOIN sys.tables t WITH (nolock)
ON st.object_id = t.object_id
INNER JOIN sys.schemas s WITH (nolock)
ON t.schema_id = s.schema_id
WHERE index_id < 2
AND Object_name(t.object_id)
IN ('MSsubscriptions',
'MSdistribution_history',
'MSrepl_commands',
'MSrepl_transactions',
)
ORDER BY st.row_count DESC
| Table Name | Description |
|---|---|
| MSsubscriptions | contains one row for each published article in a subscription |
| MSdistribution_history | contains history rows for the Distribution Agents associated with the local Distributor |
| MSrepl_commands | contains rows of replicated commands |
| MSrepl_transactions | contains one row for each replicated transaction |
If you see high rowcount (probably more than 1 or 2 million) this means there is some problem in replication. It could be one of the reasons stated below:
- Clean-up job (this is in distribution server) is not running
- Its taking lot of time to deliver the commands to subscriber
- There may be blocking in distribution server due to clean-up job
Use the below query to identify what is going on currently in the distribution server. (You can use the same query in any server for the same purpose)
SELECT r.session_id,
s.program_name,
s.login_name,
r.start_time,
r.status,
r.command,
Object_name(sqltxt.objectid, sqltxt.dbid) AS ObjectName,
Substring(sqltxt.text, ( r.statement_start_offset / 2 ) + 1, ( (
CASE r.statement_end_offset
WHEN -1 THEN
datalength(sqltxt.text)
ELSE r.statement_end_offset
END
- r.statement_start_offset ) / 2 ) + 1) AS active_statement,
r.percent_complete,
Db_name(r.database_id) AS DatabaseName,
r.blocking_session_id,
r.wait_time,
r.wait_type,
r.wait_resource,
r.open_transaction_count,
r.cpu_time,-- in milli sec
r.reads,
r.writes,
r.logical_reads,
r.row_count,
r.prev_error,
r.granted_query_memory,
Cast(sqlplan.query_plan AS XML) AS QueryPlan,
CASE r.transaction_isolation_level
WHEN 0 THEN 'Unspecified'
WHEN 1 THEN 'ReadUncomitted'
WHEN 2 THEN 'ReadCommitted'
WHEN 3 THEN 'Repeatable'
WHEN 4 THEN 'Serializable'
WHEN 5 THEN 'Snapshot'
END AS Issolation_Level,
r.sql_handle,
r.plan_handle
FROM sys.dm_exec_requests r WITH (nolock)
INNER JOIN sys.dm_exec_sessions s WITH (nolock)
ON r.session_id = s.session_id
CROSS apply sys.Dm_exec_sql_text(r.sql_handle) sqltxt
CROSS apply
sys.Dm_exec_text_query_plan(r.plan_handle, r.statement_start_offset, r.statement_end_offset) sqlplan
WHERE r.status <> 'background'
ORDER BY r.session_id
go
If you see blocking with LCK_M_S waits, this is probably due to the Clean-up job. This job runs every 10 minutes and it clears the commands that have already been replicated. It is safe to stop and disable the job for a couple of hours to clear the blocking.
Most often I noticed the root blocker is sp_MSsubscription_cleanup (This is a nested stored procedure call from sp_MSdistribution_cleanup, which is the "Distribution clean up" job) You also can notice the above stored procedure in CXPACKET wait type and it blocks the following statement.
UPDATE msdistribution_history
SET runstatus = @runstatus,
time = @current_time,
duration = @duration,
comments = @comments,
xact_seqno = @xact_seqno,
updateable_row = @this_row_updateable,
error_id = CASE @error_id
WHEN 0 THEN error_id
ELSE @error_id
END
WHERE agent_id = @agent_id
AND timestamp = @lastrow_timestamp
AND ( runstatus = @runstatus
OR ( @update_existing_row = 1
AND runstatus IN ( @idle, @inprogress )
AND @runstatus IN ( @idle, @inprogress ) ) )
The wait type for the above statement is LCK_M_X and the wait resource is MSdistribution_history table. This table is used inside the head blocker stored procedure and it already acquired the shared lock on most of the rows. I feel MS needs some optimization to this code. When I compared the clean-up job stored procedure between 2008 and 2012 versions of SQL Server, I noticed it doubled the lines of code in the 2012 version.
At the same time, you also may notice high CPU in distribution server and that is due to many blockings due to the above head blocker. There is really nothing you can do except stop and disable the clean-up job for some time. You also may try setting the MAXDOP to 1 in distribution server to bring down the CPU usage.
Improving the Latency Between Distributor And Subscriber
Again thanks to the latency report. If you identify the replication latency is between the distributor and subscriber, then it is worth considering the below points.
Publishing Stored Procedure Execution
This is especially useful in cases where large batch operations (e.g.: DELETE) are performed on the publisher. I have seen cases where millions of rows are affected due to a large batch delete and the moment they occurred it started to transfer the commands to the distributor and then the subscriber. This slows replication and you can notice increased latency. Using this method, the same large batch operation execute at the subscriber instead of passing individual commands via the distributor. However before implementing this solution you need to spend time doing some research and assess how feasible this is for your environment. There are many factors that you need to be aware of.
For more detail: http://msdn.microsoft.com/en-us/library/ms152754.aspx
Enable Multiple Streams for Subscriber
Enabling multiple streams for the subscriber can greatly improve aggregate transactional replication throughput by applying the subscriber changes in parallel. Still there are many factors you need to consider and you need to do some homework before getting this to production.
For more details: http://technet.microsoft.com/en-us/library/ms151762(v=sql.105).aspx
Maintain Indexes and Statistics in Distribution Database
Distribution database is categorized as a system database in SSMS. However some level of DBA intervention is needed to keep the distribution database in good shape. Distribution database has tables, indexes and statistics like normal user databases. We know for a fact that indexes need to be maintained (rebuild/reorganize) as well as running update statistics in user databases, so why not the same operations in the distribution database? The clean-up stored procedures has its own statistics update statements to keep the statistics up to date, but not for all of them. It is totally fine to have index and statistics update jobs deployed to the distribution database and schedule them to run at off-peak time as you do in user databases. I have done this in production environments as per MS suggestion.
Distribution Agent Performance
You can query MSdistribution_history table to see how Distribution Agent performs.
USE distribution
go
SELECT TOP 100 time,
Cast(comments AS XML) AS comments,
runstatus,
duration,
xact_seqno,
delivered_commands,
average_commands,
current_delivery_rate,
delivered_transactions,
error_id,
delivery_latency
FROM msdistribution_history WITH (nolock)
ORDER BY time DESC
The output of the above query is similar to the output of the Log Reader history table. Look at the value of the Comments column. If you see messages with state 1 which means Distribution Agent is performing normally. Using xact_seqno you can identify the commands replicated. If you notice the same value for xact_seqno for a longer time which means it is replicating a large transaction.
Distribution Agent Profile
Like the Log Reader Agent Profile, there is a Distribution Agent Profile on the distribution server. If you open Agent Profiles window (Refer Figure 4) from the right pane you can select Distribution Agents to see the profiles. You can tweak the parameter values of the agent to change the replication behavior. You can do it at the publication level or apply to all publications. It will need a SQL Server Agent restart in distribution server to take effect.
Below are some parameters you may consider tweaking:
- -CommitBatchSize - Is the number of transactions to be issued to the Subscriber before a COMMIT statement is issued. The default is 100.
- -CommitBatchThreshold - Is the number of replication commands to be issued to the Subscriber before a COMMIT statement is issued. The default is 1000.
- -HistoryVerboseLevel[ 0 | 1 | 2 | 3 ] - Specifies the amount of history logged during a distribution operation. You can minimize the performance effect of history logging by selecting 1.
- -MaxDeliveredTransactions - Is the maximum number of push or pull transactions applied to Subscribers in one synchronization. A value of 0 indicates that the maximum is an infinite number of transactions. Other values can be used by Subscribers to shorten the duration of a synchronization being pulled from a Publisher.
- -PollingInterval - Is how often, in seconds, the distribution database is queried for replicated transactions. The default is 5 seconds.
- -SubscriptionStreams [0|1|2|...64] - Is the number of connections allowed per Distribution Agent to apply batches of changes in parallel to a Subscriber, while maintaining many of the transactional characteristics present when using a single thread. For a SQL Server Publisher, a range of values from 1 to 64 is supported. This parameter is only supported when the Publisher and Distributor are running on SQL Server 2005 or later versions. This parameter is not supported or must be 0 for non-SQL Server Subscribers or peer-to-peer subscriptions.
For more details: BOL: http://msdn.microsoft.com/en-us/library/ms147328.aspx
Next Steps
- Still you see issues such as high CPU in distributor, continuous blocking in distribution server, increased latency even after working on the suggested changes in this article, you probably require more analysis and maybe need to open a case with Microsoft.
- For further analysis, see this link. It has instructions/scripts to gather more data.
- Check out all of the SQL Server Replication tips.


About the author
 Susantha Bathige currently works at Pearson North America as a Production DBA. He has over ten years of experience in SQL Server as a Database Engineer, Developer, Analyst and Production DBA.
This author pledges the content of this article is based on professional experience and not AI generated.
View all my tips
