By: Koen Verbeeck | Comments (8) | Related: > SQL Server 2016
Problem
SQL Server 2016, which is at the time of writing is in preview release CTP 2.1, has a great new feature called Live Query Statistics. It allows you to view a live execution plan of an active query, which gives us a fantastic opportunity for troubleshooting and debugging. This tip will give an introduction to this exciting new feature.
Solution
Live Query Statistics is a feature introduced in SQL Server 2016. It provides you with a live execution plan which displays overall query progress and run-time execution statistics such as elapsed time, operator progress, number of rows processed and so on. It goes without saying that this feature will be an excellent addition in your toolkit for performance troubleshooting and for the debugging of queries.
SQL Server 2016 Live Query Statistics Test Environment
In order to have a query executing long enough to see something actually happening in the execution plan, I used alternative versions of some AdventureWorks tables. These tables are generated by a script created by Adam Machanic (blog | twitter), which can be downloaded here. The script basically generates a large product table with 25,200 products and a transaction table with over 31 million transactions. Executing those scripts will keep SQL Server occupied for a while.
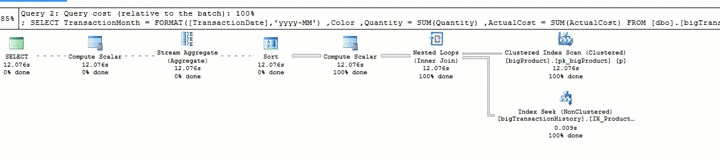
I used the following test query, which takes over 4 minutes to execute on my system:
SELECT
	 TransactionMonth	= FORMAT([TransactionDate],'yyyy-MM')
	,Color
	,Quantity			= SUM(Quantity)
	,ActualCost			= SUM(ActualCost)
FROM [dbo].[bigTransactionHistory]	t
JOIN [dbo].[bigProduct]				p ON t.ProductID = p.ProductID
GROUP BY FORMAT([TransactionDate],'yyyy-MM'), Color;
It returns the aggregated values for Quantity and ActualCost per product color on a monthly basis.
Using Live Query Statistics
To view Live Query Statistics in action, you can simply enable it for the current session in Management Studio by clicking on its icon in the tools menu.
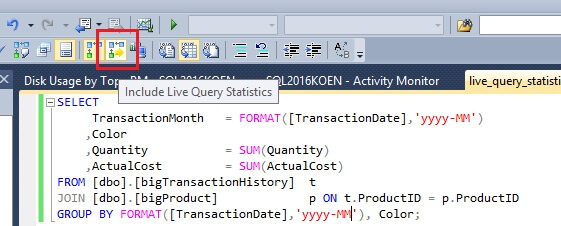
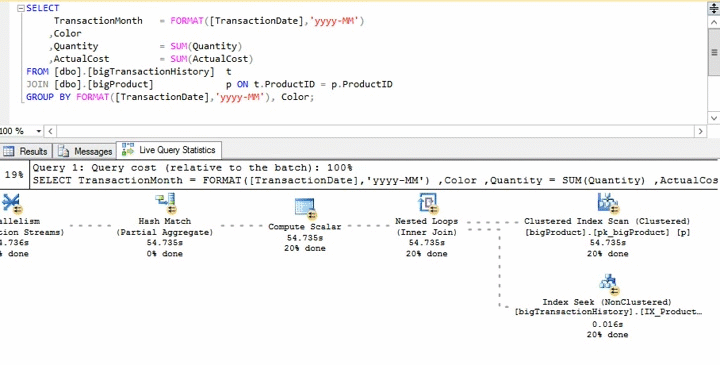
When you execute the query, an extra tab is added in the results pane holding the live execution plan.
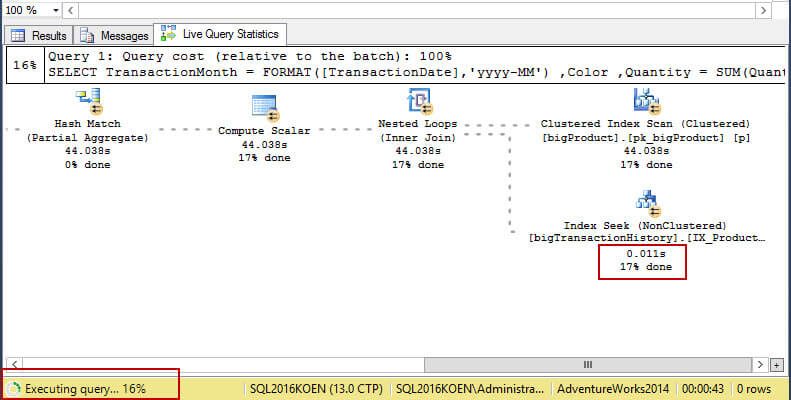
You can immediately tell the difference with a normal execution by the dotted lines, instead of the full arrows. As you can see in the screenshot, each operator has an indicator of how much work is already done and how much time it spent working. At the bottom, you also get an overall progress indicator.
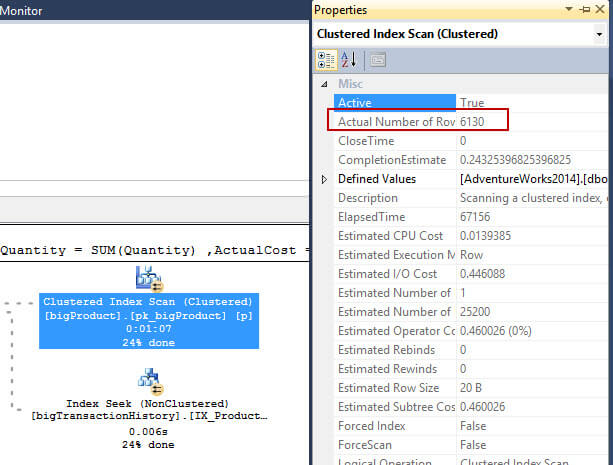
You can see the number of rows processed when you open up the properties window of an operator. This window will constantly refresh when the query is running.
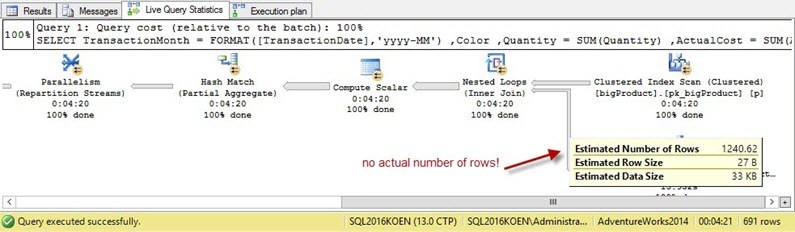
When the query is finished, the arrows return to normal and the plan resembles an estimated execution plan. Remark that actual rows are not being displayed as in an actual execution plan.
This is how Live Query Statistics look in real-time:
You can also view a live execution plan through Activity Monitor, however the statistics profile infrastructure must already be enabled for the session, which is currently one of the biggest disadvantages of Live Query Statistics!
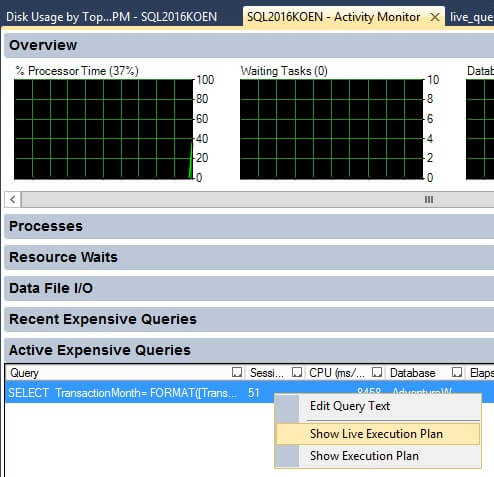
If it isn’t, the option will be grayed out.
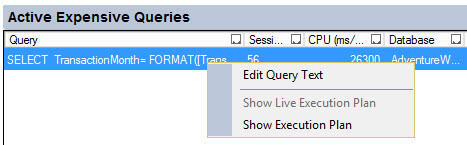
There are other options as well to enable Live Execution Plans on a query:
- Before you start the query, run SET STATISTICS PROFILE ON or SET STATISTICS XML ON. With both statements, you will be able to view the Live Execution Plan through Activity Monitor, but you won’t see the live plan in the query window itself.
- You can enable the query_post_execution_showplan extended event. Be aware that this is a server-wide setting that will enable Live Query Statistics on any session. This can have of course a serious performance impact.
Limitations of Live Query Statistics
There are currently a few limitations when working with Live Query Statistics:
- Columnstore indexes are not supported
- Memory-optimized tables are not supported
- Natively compiled stored procedures are not supported
A Live Execution Plan is also just as good as the statistics of the underlying tables. If there are issues with those, these can be reflected in the plan. Let’s illustrate with an example.
Using the following undocumented statement, we can trick SQL Server into thinking dbo.BigProduct has only 10 rows.
UPDATE STATISTICS [dbo].[bigProduct]
WITH ROWCOUNT = 10;
The optimizer will create a plan using an incorrect estimate. When we take a look at the Live Execution Plan, we can see that immediately after the query started running some of the arrows are already solid and some operators are already at 100%, although the query is still running.
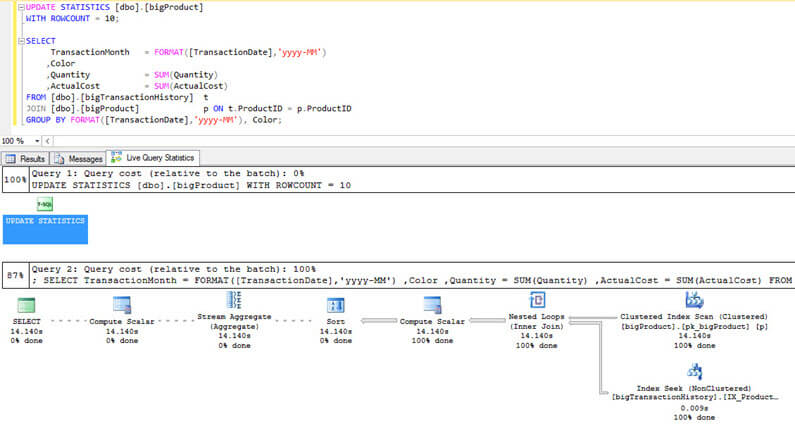
The index seek at the bottom keeps resetting and in real-time you can observe this behavior:
You can read more about updating statistics using a specific row count in the blog post UPDATE STATISTICS undocumented options.
Conclusion
Live Query Statistics are a very useful new tool in the tool belt of the T-SQL developer. A live execution plan allows you to directly take a look how the query is executing and to find out where the bottlenecks are. There are currently some limitations, but hopefully they will be resolved in the future.
Next Steps
- Try it out yourself! Use the query from this tip and start a session where Live Query Statistics are enabled. You of course need an instance with the SQL Server 2016 preview.
- You can read the official documentation about Live Query Statistics here.
- The following tip gives an overview of all the new features in SQL Server 2016 CTP2.
- For more information, read these tips on SQL Server 2016.


About the author
 Koen Verbeeck is a seasoned business intelligence consultant at AE. He has over a decade of experience with the Microsoft Data Platform in numerous industries. He holds several certifications and is a prolific writer contributing content about SSIS, ADF, SSAS, SSRS, MDS, Power BI, Snowflake and Azure services. He has spoken at PASS, SQLBits, dataMinds Connect and delivers webinars on MSSQLTips.com. Koen has been awarded the Microsoft MVP data platform award for many years.
This author pledges the content of this article is based on professional experience and not AI generated.
View all my tips
