By: Koen Verbeeck | Comments (3) | Related: > Analysis Services Performance
Problem
In SQL Server 2016 we have the option to start an Extended Events session using SQL Server Management Studio. I would like to know how I can use this solution to find the query plan for a DAX query, just like we can for T-SQL statements.
Solution
Extended Events is a light-weight tracing and event capturing solution for SQL Server and Analysis Services. It’s the replacement for SQL Server Profiler (which is still around though) and was introduced in SQL Server 2008. In SQL Server 2012, Extended Events (xEvents) were included for Analysis Services as well, but there was no graphical user interface. SQL Server 2016 introduced a user interface for xEvents in SSAS. In this tip, we will use xEvents to find the DAX query plan so it can be used for query optimization purposes.
If you would like to learn more about xEvents for SSAS, you can check out these tips:
- Manage Extended Events for SQL Server 2016 Analysis Services in Management Studio
- Using Extended Events to monitor DAX queries for SSAS Tabular Databases
The Test Query
We will use a DAX query against the WideWorldImporters Tabular model. You can find out more about this model in the tip Using Calculated Tables in Analysis Services Tabular 2016 for Aggregate Tables – Part 3. We execute the following DAX query against the model:
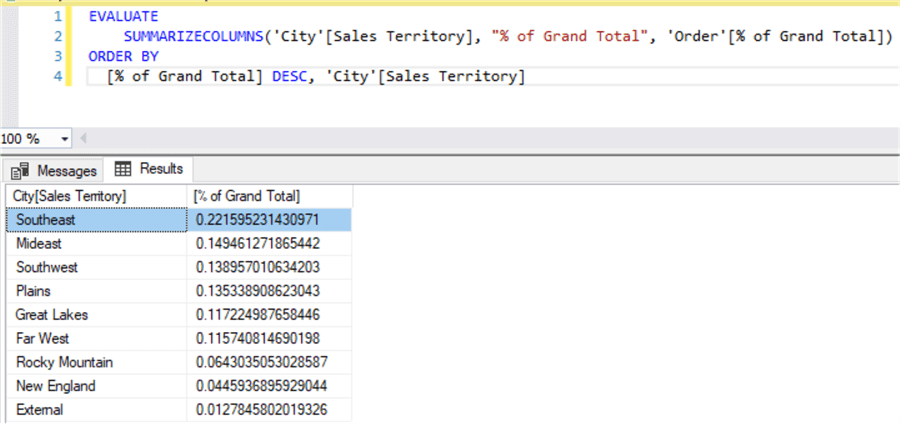
EVALUATE
    SUMMARIZECOLUMNS('City'[Sales Territory], "% of Grand Total", 'Order'[% of Grand Total])
ORDER BY
  [% of Grand Total] DESC, 'City'[Sales Territory]
In the latest release of SQL Server Management Studio you can execute DAX queries:
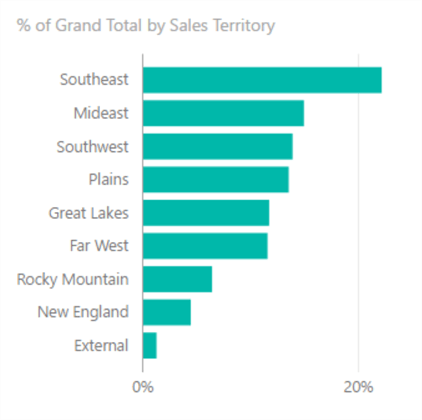
This query is the equivalent of the following visual in Power BI Desktop:
The “% of Grand Total” is calculated with the following formula:
% of Grand Total:= VAR GrandTotal = CALCULATE([Total Sales],ALL('Order')) -- our variable
      RETURN DIVIDE([Total Sales],GrandTotal) -- when using variables, use the RETURN keyword to return the result of the formula
It was introduced in the tip Enhancements for the DAX language in Analysis Services 2016.
Starting the xEvents Session
The following xEvents XMLA statement will create an xEvents session that will track the following events:
- DAXQueryPlan - which as the name suggests, tracks the query plans
- QueryEnd - which will give an indication of the execution time and it also contains the actual DAX query
- VertipaqSEQueryEnd - which tracks the storage engine (SE) queries. Vertipaq was the initial codename for the Power Pivot technology (which also runs behind the scenes in SSAS Tabular, Power BI Desktop and columnstore indexes).
<Create xmlns="http://schemas.microsoft.com/analysisservices/2003/engine">
  <ObjectDefinition>
    <Trace>
      <ID>test</ID>
      <Name>test</Name>
      <XEvent xmlns="http://schemas.microsoft.com/analysisservices/2011/engine/300/300">
        <event_session name="test" dispatchLatency="0" maxEventSize="0" maxMemory="4" memoryPartition="none" eventRetentionMode="AllowSingleEventLoss" trackCausality="true" xmlns="http://schemas.microsoft.com/analysisservices/2003/engine">
          <event package="AS" name="DAXQueryPlan" />
          <event package="AS" name="QueryEnd" />
          <event package="AS" name="VertiPaqSEQueryEnd" />
          <target package="package0" name="event_stream" />
        </event_session>
      </XEvent>
    </Trace>
  </ObjectDefinition>
</Create>
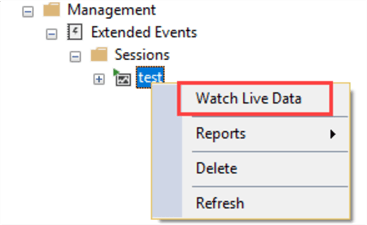
The output of the session is sent as an event stream, which you can watch live in SSMS:
Finding the Query Plan
Let’s start the live stream and run our query. As you can see, 5 events have been captured:
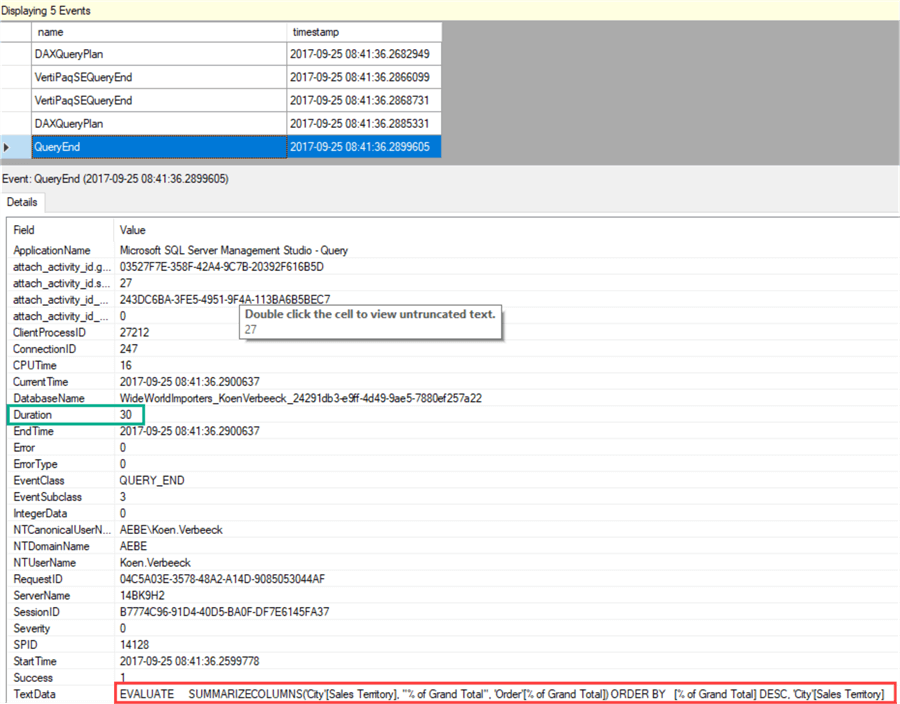
The QueryEnd event contains the DAX query, as indicated in the screenshot, but also the duration which was only 30ms. Let’s take a look at the DAXQueryPlan event to find the query plan. There are actually two plans: the logical plan and the physical plan. The logical plan can be found in the first DAXQueryPlan event.
Double clicking on the TextData field gives a pop-up with the full textual DAX query plan:
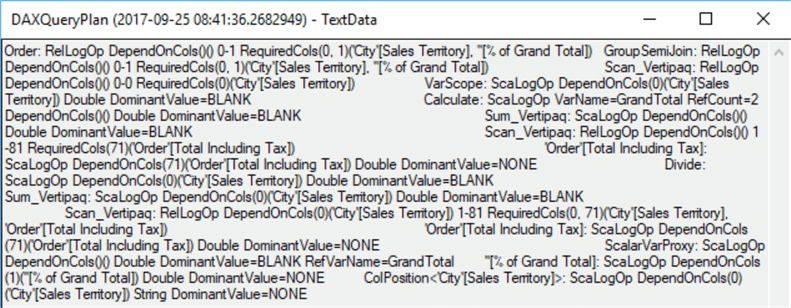
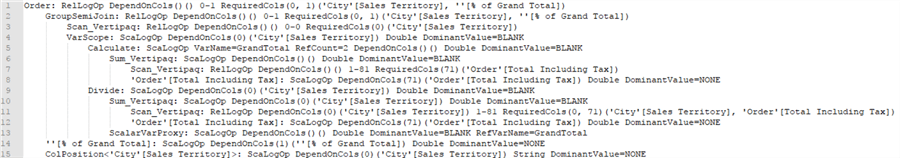
Unfortunately, there’s no graphical query plan like we have for T-SQL queries. The plan looks quite messy, so let’s format it a bit:
When we remove all the parameters, we have the following left:
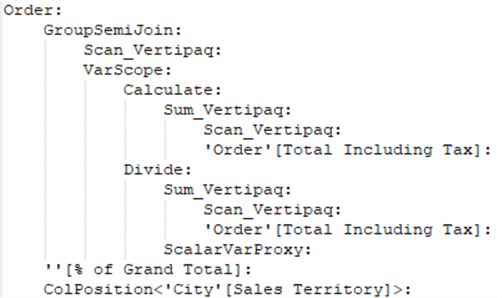
In the logical query plan, we can recognize our original query which calculated the percentage of grand total for the sales territories, first ordered by descending result and then by sales territory. The percentage of grand total was calculated by storing the grand total of [Total Including Tax] in a variable first (which corresponds with VarScope) and then dividing the sum of Total Including Tax by this grand total. All of this is directly reflected in the logical query plan.
The physical query plan translates the logical plan into physical operators. It looks like this:
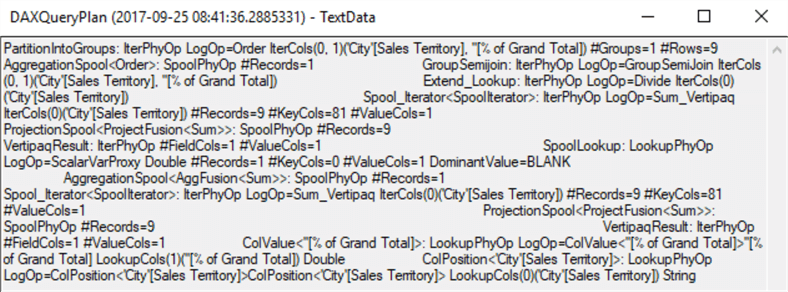
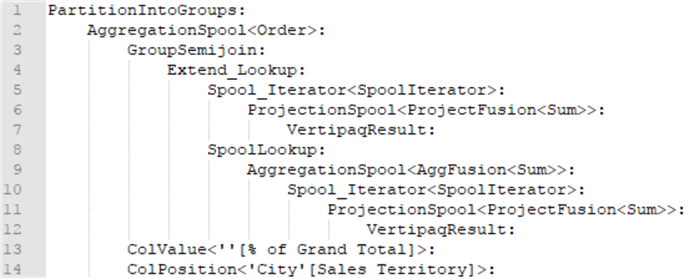
Let’s format the plan a bit:
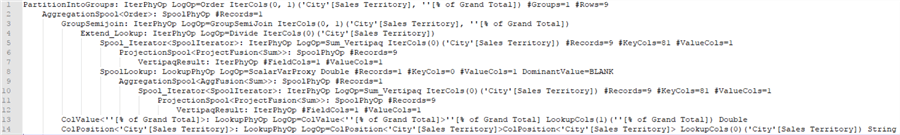
When we remove all the parameters, this is what we have left:
We can also take a look at the storage engine queries. There are two xmSQL queries (which are the queries used by the storage engine):
SET DC_KIND="DENSE";
SELECT
    [City (25)].[Sales Territory (109)] AS [City (25)$Sales Territory (109)]
   ,SUM([Order (22)].[Total Including Tax (102)]) AS [$Measure0]
   ,COUNT()
FROM [Order (22)]
LEFT OUTER JOIN [City (25)] ON [Order (22)].[City Key (86)]=[City (25)].[City Key (104)];

SET DC_KIND="AUTO";
SELECT
    [City (25)].[Sales Territory (109)] AS [City (25)$Sales Territory (109)]
   ,SUM([Order (22)].[Total Including Tax (102)]) AS [$Measure0]
FROM [Order (22)]
LEFT OUTER JOIN [City (25)] ON [Order (22)].[City Key (86)]=[City (25)].[City Key (104)];


[Estimated size (volume, marshalling bytes): 13, 208]
As you can see, they have a structure very familiar to regular SQL. One query is most likely to retrieve the value for the variable (the grand total) and the other query to retrieve the values of [Total Including Tax] for the different Sales Territories. This is why using variables can optimize the performance of your DAX queries: only one storage engine query is used to retrieve the value, which is then re-used throughout the entire formula. Without variables, multiple storage engine queries are needed to retrieve the same value multiple times.
All of this information can also be retrieved using SQL Server Profiler or by using DAX Studio.
Next Steps
- Try it out yourself! Use your favorite tool (Extended Events, SQL Server Profiler or DAX Studio) to take a look at a couple of DAX query plans.
- If you want to learn more about these query plans and how you can use them to optimize your DAX queries, you can take a look at chapter 15 “Analyzing DAX Query Plans” of the book The Definitive Guide to DAX: Business intelligence with Microsoft Excel, SQL Server Analysis Services, and Power BI.
- For all of the new features in Analysis Services 2016, check out What’s new in SSAS 2016 part 1 and part 2.
- You can find more Analysis Services tips in this overview.
- For more SQL Server 2016 tips, you can use this overview.


About the author
 Koen Verbeeck is a seasoned business intelligence consultant at AE. He has over a decade of experience with the Microsoft Data Platform in numerous industries. He holds several certifications and is a prolific writer contributing content about SSIS, ADF, SSAS, SSRS, MDS, Power BI, Snowflake and Azure services. He has spoken at PASS, SQLBits, dataMinds Connect and delivers webinars on MSSQLTips.com. Koen has been awarded the Microsoft MVP data platform award for many years.
This author pledges the content of this article is based on professional experience and not AI generated.
View all my tips
