By: Ben Snaidero | Comments | Related: > Monitoring
Problem
In my last tip, SQL Server Performance Troubleshooting System Health Checklist, we went through a series of system level checks using PowerShell in order to get an overview of the performance/health of your SQL Server database server. So, what happens if you do end up seeing some deviations from your baseline when you gather the results of this test? In this tip we will go through a series of database level checks you can perform in order to try to pinpoint the root cause of any performance issues you might be experiencing.
Solution
In the last tip we performed all the checks using one tool, PowerShell. For this tip, although a lot of it could be done using just PowerShell, we will use a few different tools just for simplicity since in most cases after performing your system level checks you will have a pretty good idea where to start looking.
High Level Errors
The first place I always check when looking into any database issue is the error log. I sometimes even include this check as a part of the system level check as many high-level errors are reported here. Things like IO taking too long, failed logins, files that are unable to extend is all reported here. I usually just use PowerShell to gather this information since it's easy to filter using the WHERE-OBJECT clause and also because it fits nicely with the commands from the first tip (I sometimes run it as a part of my baseline check as well). You can alternatively get the same information using SSMS or just opening the ERRORLOG file using notepad.
To get the messages reported in the SQL Server error log for the last 24 hours you can use the following PowerShell command to query them from the event log.
Get-EventLog -After (Get-Date).AddHours(-24) -LogName "Application" -Source "MSSQLSERVER"
And here is a sample output from this command.
Index Time          EntryType   Source       InstanceID Message
----- ----          ---------   ------       ---------- -------
19360 Mar 01 09:39  Information MSSQLSERVER  1073759001 This instance of SQL Server has been using a process ID of 4144 since 2/21/2018 9:02:59 AM (local...
17817 Feb 21 09:03  FailureA... MSSQLSERVER  3221243928 Login failed for user 'testuser'. Reason: Password did not match that for the login provided. [CLIENT: ...
17466 Feb 20 14:48  Information MSSQLSERVER  1073751514 The Database Mirroring endpoint is now listening for connections.
17465 Feb 20 14:48  Information MSSQLSERVER  1073767846 Server is listening on [ 'any' <ipv4> 7022].
17464 Feb 20 14:48  Information MSSQLSERVER  1073767846 Server is listening on [ 'any' <ipv6> 7022].
17463 Feb 20 14:48  Information MSSQLSERVER  1073751490 The Database Mirroring endpoint is in disabled or stopped state.
17462 Feb 20 14:48  Information MSSQLSERVER  1073751515 The Database Mirroring endpoint has stopped listening for connections.
17459 Feb 20 14:47  Error       MSSQLSERVER  1073743267 Database mirroring has been terminated for database 'test'. This is an informational message o...
17449 Feb 20 14:47  Error       MSSQLSERVER  3221226946 Database mirroring connection error 4 'An error occurred while receiving data: '10054(An existing...
17447 Feb 20 14:46  Error       MSSQLSERVER  1073743267 Database mirroring has been terminated for database 'test'. This is an informational message o...
17437 Feb 20 14:46  Error       MSSQLSERVER  3221226946 Database mirroring connection error 4 'An error occurred while receiving data: '24(The program is...
17435 Feb 20 14:44  Error       MSSQLSERVER  1073743267 Database mirroring has been terminated for database 'test'. This is an informational message o...
17425 Feb 20 14:44  Error       MSSQLSERVER  3221226946 Database mirroring connection error 4 'An error occurred while receiving data: '24(The program is...
Check for blocking queries
The next thing I usually check for is blocking queries. To get a high-level count of the number of blocked processes in your SQL Server instance you can use the following PowerShell command.
Get-Counter '\SQLServer:General Statistics\Processes blocked'
As you can see in the output below this command just gives us the number of blocked processes.
Timestamp              CounterSamples
---------              --------------
3/1/2018 11:21:15 PM   \\home-pc\sqlserver:general statistics\processes blocked : 1
In order to get more details on the blocking processes we will have to use some T-SQL queries. The following query will give you details on the blocked and blocking processes.
select * from
   (select blockeds.session_id,blockedr.blocking_session_id,start_time,blockedr.total_elapsed_time,
           wait_type,wait_time,blockedr.cpu_time,blockedr.reads,blockedr.writes,
           blockedr.logical_reads,
           case when blocking_session_id = 0 then 'HEAD'
           else CAST(blockedr.session_id as varchar) end "blocked_by_session"
      from sys.dm_exec_sessions blockeds
      left join sys.dm_exec_requests blockedr ON
             blockeds.session_id = blockedr.session_id) blocked
inner join
   (select blockings.session_id,blockingr.blocking_session_id,start_time,
           blockingr.total_elapsed_time,wait_type,wait_time,
           blockingr.cpu_time,blockingr.reads,blockingr.writes,blockingr.logical_reads,
           case when blocking_session_id = 0 then 'HEAD'
           else CAST(blockingr.session_id as varchar) end "blocked_by_session"
      from sys.dm_exec_sessions blockings
      left join sys.dm_exec_requests blockingr ON
             blockings.session_id = blockingr.session_id) blocking
on blocked.blocking_session_id=blocking.session_id;
Here is a sample out from this query. I've just included they first few columns from the query result in the interest of space as they are required in the next step.
session_id blocking_session_id start_time              total_elapsed_time wait_type wait_time...
---------- ------------------- ----------------------- ------------------ --------- ---------
56         55                  2018-03-01 10:58:25.117 7255               LCK_M_S   7254
Once you have the session_id's of the processes involved in the blocking (from the session_id and blocking_session_id columns above) you can run the following query to identify the last query run by each session. More details on this query can be found in this tip.
select most_recent_session_id as session_id,dest.text as query
  from sys.dm_exec_connections sdec
cross apply sys.dm_exec_sql_text(sdec.most_recent_sql_handle) AS dest
where sdec.most_recent_session_id IN (55,56);
After running this query we can see below that an update has yet to commit and it is blocking a select query.
session_id query
---------- -----------------------------------------------------------------------
55         begin transaction  update testtable_bigint set col1=23 where pk_col=10;
56         (@1 tinyint)SELECT * FROM [testtable_bigint] WHERE [pk_col]=@1
Check for long running queries
Similar to the previous check the next thing I check for is any long running queries. Usually this will point to either a poorly written query or a query that has missing indexes on the table and is doing a full table scan. The following query will show you any queries that have been running in your SQL Server instance for longer than 5 seconds (this of course can be changed). It will also give you the explain plan for the queries returned.
select session_id,start_time,total_elapsed_time,wait_type,wait_time,
       cpu_time,reads,writes,logical_reads,
       case when blocking_session_id = 0 then 'N\A'
       else CAST(session_id as varchar) END "blocked_by_session",
       sqltext.text,sqlplan.query_plan
  from sys.dm_exec_requests CROSS APPLY sys.dm_exec_sql_text(sql_handle) AS sqltext
CROSS APPLY sys.dm_exec_query_plan(plan_handle) as sqlplan
where status not in ('sleeping','background')
   and total_elapsed_time > 5000; -- 5 seconds
Below is a sample output from this query
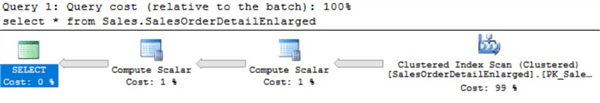
session_id start_time              total_elapsed_time wait_type wait_time cpu_time reads writes  logical_reads blocked_by_session text                                         query_plan
---------- ----------------------- ------------------ --------- --------- -------- ------ ------ ------------- ------------------ -------------------------------------------- -------------------------------------------------------------
54         2018-03-01 11:41:17.533 123724             NULL      0         16073    364536 0      1025604       N\A                select * from Sales.SalesOrderDetailEnlarged <ShowPlanXML xmlns="http://schemas.microsoft.com/sqlserver/...
And clicking data value in the query_plan column (.sqlplan) we can see that the query is performing a scan of the SalesOrderDetailEnlarged table.
Check for high resource usage queries
Most of the items above are point in time views of your database performance. The last thing I usually check is to capture a wider time range of query performance. This is especially useful when there is a known time of day that the SQL Server performance degrades. To gather this information, I use a SQL Profiler Trace and I filter for queries based on some combination of CPU usage, reads, writes and total duration depending on what issue I am trying to troubleshoot. Picking these values to use for these filters in order to exclude queries that are not an issue are totally dependent on your system although for an OLTP environment I usually start with some combination of the filters and values shown in the template below. Using a template like this makes it easy to rerun your trace and the only update required is the file name.
declare @rc int
declare @TraceID int
declare @maxfilesize bigint
set @maxfilesize = 5

exec @rc = sp_trace_create @TraceID output, 0, N'InsertFileNameHere', @maxfilesize, NULL
if (@rc != 0) goto error

-- Set the events
declare @on bit
set @on = 1
-- eventid 10 = "RPC:Completed"
-- eventid 12 = "SQL:BatchCompleted"
-- columnid 1 = "TextData"
-- columnid 10 = "ApplicationName"
-- columnid 6 = "NTUserName"
-- columnid 11 = "LoginName"
-- columnid 12 = "SPID"
-- columnid 13 = "Duration"
-- columnid 14 = "StartTime"
-- columnid 15 = "EndTime"
-- columnid 16 = "Reads"
-- columnid 17 = "Writes"
-- columnid 18 = "CPU"
exec sp_trace_setevent @TraceID, 10, 1, @on
exec sp_trace_setevent @TraceID, 10, 10, @on
exec sp_trace_setevent @TraceID, 10, 6, @on
exec sp_trace_setevent @TraceID, 10, 11, @on
exec sp_trace_setevent @TraceID, 10, 12, @on
exec sp_trace_setevent @TraceID, 10, 13, @on
exec sp_trace_setevent @TraceID, 10, 14, @on
exec sp_trace_setevent @TraceID, 10, 15, @on
exec sp_trace_setevent @TraceID, 10, 16, @on
exec sp_trace_setevent @TraceID, 10, 17, @on
exec sp_trace_setevent @TraceID, 10, 18, @on
exec sp_trace_setevent @TraceID, 12, 1, @on
exec sp_trace_setevent @TraceID, 12, 11, @on
exec sp_trace_setevent @TraceID, 12, 6, @on
exec sp_trace_setevent @TraceID, 12, 10, @on
exec sp_trace_setevent @TraceID, 12, 12, @on
exec sp_trace_setevent @TraceID, 12, 13, @on
exec sp_trace_setevent @TraceID, 12, 14, @on
exec sp_trace_setevent @TraceID, 12, 15, @on
exec sp_trace_setevent @TraceID, 12, 16, @on
exec sp_trace_setevent @TraceID, 12, 17, @on
exec sp_trace_setevent @TraceID, 12, 18, @on

-- Set the Filters
declare @intfilter int
declare @bigintfilter bigint

exec sp_trace_setfilter @TraceID, 10, 0, 7, N'SQL Server Profiler - b3d074d2-d348-4984-9c60-d07bd25123a3'

-- columnid 13 = "Duration"
set @bigintfilter = 3000000
exec sp_trace_setfilter @TraceID, 13, 0, 4, @bigintfilter

-- columnid 16 = "Reads"
set @bigintfilter = 5000
exec sp_trace_setfilter @TraceID, 16, 0, 4, @bigintfilter

-- columnid 17 = "Writes"
set @bigintfilter = 1000
exec sp_trace_setfilter @TraceID, 17, 0, 4, @bigintfilter

-- columnid 18 = "CPU"
set @intfilter = 1000
exec sp_trace_setfilter @TraceID, 18, 0, 4, @intfilter

-- Set the trace status to start
exec sp_trace_setstatus @TraceID, 1

-- display trace id for future references
select TraceID=@TraceID
goto finish

error:
select ErrorCode=@rc

finish:
go
For reference I've included a small sample trace output below. For more information on using SQL Profiler you could check out the following tip.

Next Steps
- Read other tips on monitoring
- Read other tips on PowerShell
- Read more details on blocking queries
- Read other tips on finding poor performing queries
- Read other tips on using SQL Profiler
- Read other tips on performance tuning


About the author
 Ben Snaidero has been a SQL Server and Oracle DBA for over 10 years and focuses on performance tuning.
This author pledges the content of this article is based on professional experience and not AI generated.
View all my tips
