By: Koen Verbeeck | Comments (2) | Related: > Analysis Services Development
Problem
I have a table with a parent-child relationship: employees and their managers. I need to show this data using Analysis Services Tabular, but it doesn’t support parent-child relationships. Is there a work around?
Solution
Since the introduction of the Power Pivot engine in Office 2010 - on which the in-memory columnstore engine of Analysis Services (SSAS) Tabular is based - till the most recent version of SSAS Tabular 2017, there has been no direct support for parent-child relationships. Unlike Analysis Services Multidimensional, which has out-of-the-box support. In the Tabular model however, it is not possible to create a relationship between a table and itself.
Luckily, there’s a work around: we can model the parent-child relationship as a natural hierarchy. A natural hierarchy has a fixed number of levels (while a parent-child relationship can have in theory an indeterminate number of levels). Let’s illustrate with an example. Here we have a simple parent-child relationship:
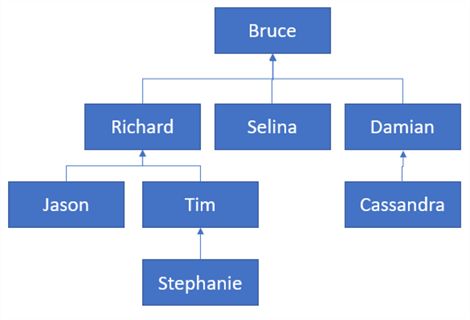
As you can see, some branches can go deeper than others. The branch from Selina to Bruce is only 1 level deeper, while Stephanie is 3 levels deeper than Bruce. Some parents have children, others do not. Some have only one child, others have multiple, and so on. When modeled like a natural hierarchy, the organizational chart becomes:
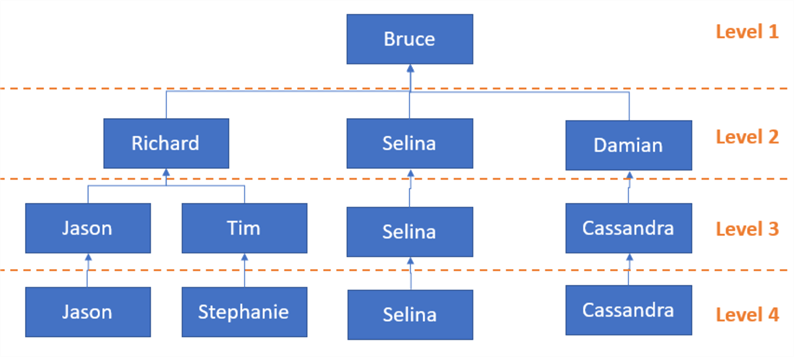
There is now a fixed number of levels. If a node doesn’t have children, it is repeated into the next level.
SSAS Tabular can support hierarchies like this one. Let’s take a look at an example.
Test Set-up
As a source of sample data, we’re going to use the AdventureWorks 2017 data warehouse, which can be downloaded from Github. In the data warehouse, we’re going to use the employee dimension – which has a parent-child relationship between an employee and his/her manager – and the reseller sales fact table. Create a new SSAS Tabular project in Visual Studio (you can download the latest versions of SSDT here, or you can install the Analysis Services Projects extension in Visual Studio 2017). In this tip we will use the Modern Get Data experience to load data into the model. You can learn more about it in the tip How to import data for SSAS Tabular vNext.
While the model is opened, click on Model in the title bar and choose Import From Data Source…
In the Get Data dialog, choose Database and then SQL Server database.
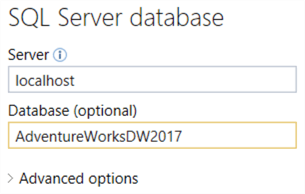
In the next step, enter the server and database name.
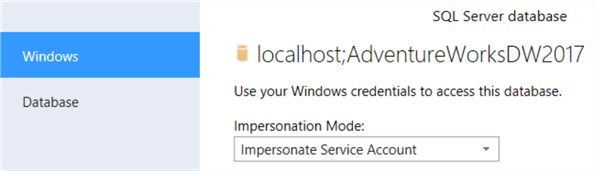
After that, you need to choose the credential to connect to the database. Make sure these credentials have read permissions on the AdventureworksDW2017 database.
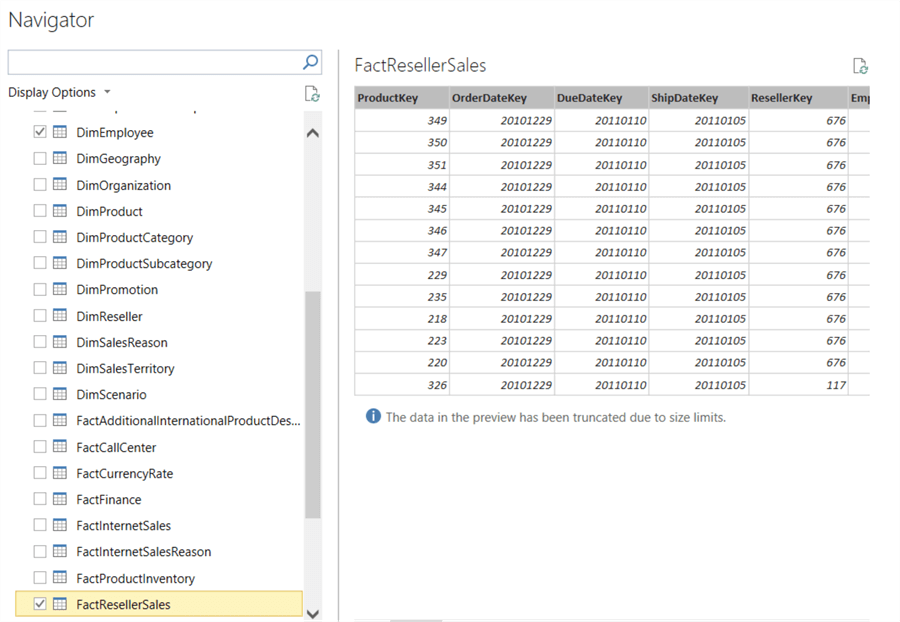
In the Navigator, select the DimEmployee and the FactResellerSales tables:
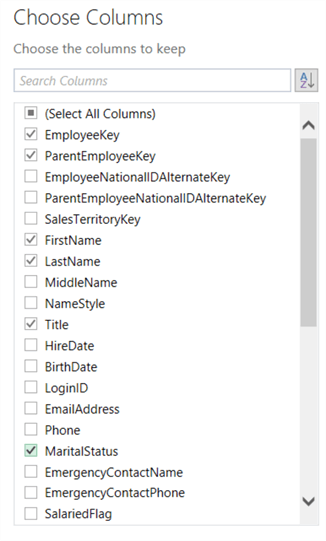
When clicking OK, the query editor will open (which is similar to Power Query and the query editor of Power BI Desktop). The first step is to choose the columns of the DimEmployee dimension.
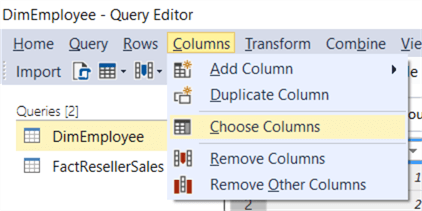
You can simply select the columns you want to keep. We will retain the following columns: EmployeeKey, ParentEmployeeKey, FirstName, LastName, Title, Marital Status, Gender, Department and Status.
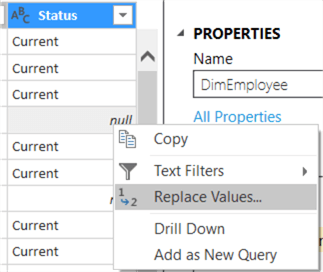
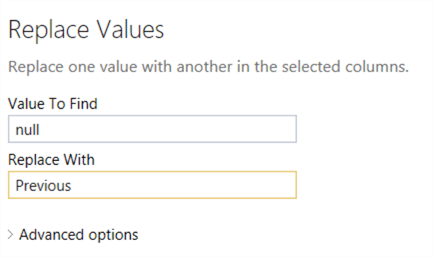
Next we will clean up the Status column (which indicates the current row for an employee). We will replace null values with “Previous”. Right-click on a null value and choose Replace Values…
In the editor, type Previous in the “Replace With” field:
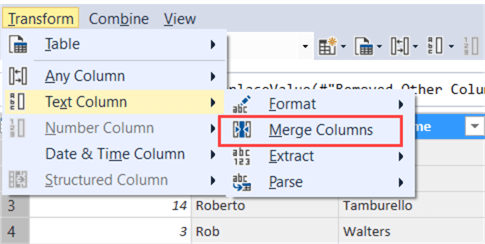
Now we’re going to create an extra column that contains the concatenation of the last name with the first name. Select the LastName column, hold CTRL and then select the FirstName column. In the Transform menu at the top, choose Text Column and then Merge Columns.
In the editor, choose comma as delimiter and name the new column FullName.
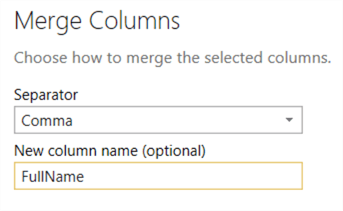
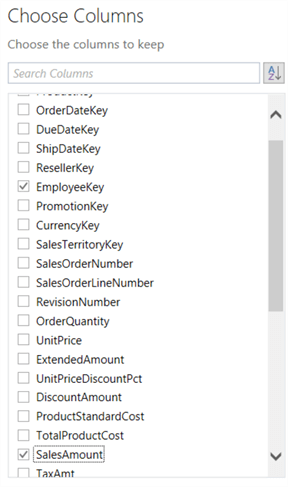
As a result, the FullName column will replace the FirstName and LastName columns. Let’s take a look at the query for FactResellerSales. There we will only keep the EmployeeKey column and the SalesAmount.
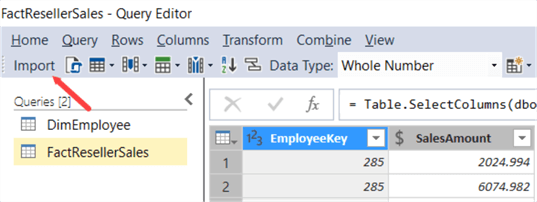
Now we’re ready to import the data into the model:
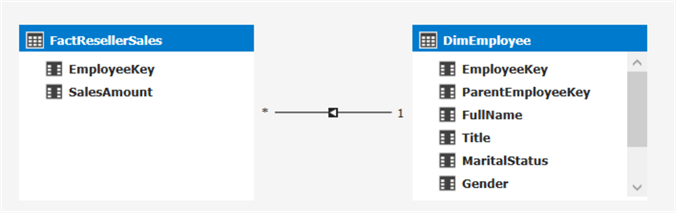
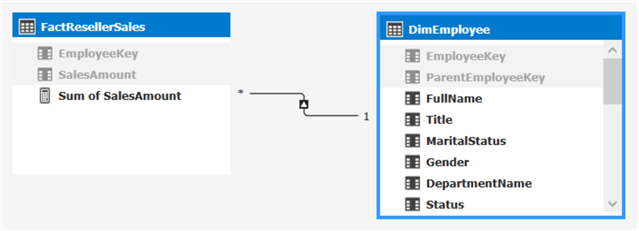
When the data has been loaded, the model has automatically detected the relationship between the two tables:
If we want to use the SalesAmount column in Excel later on for testing, we need to create an explicit measure first (Power BI Desktop doesn’t have this problem and can work with implicit measures, aka numeric columns with no measures defined on them). We can do this by selecting the SalesAmount column and then by clicking on the summation symbol sigma:
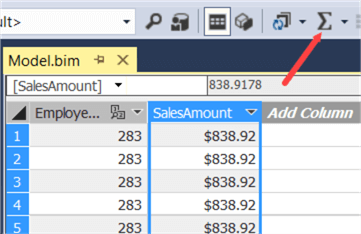
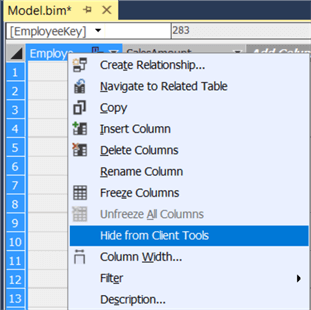
This will create an explicit measure with the default aggregation of sum. As a best practice, we will also hide the EmployeeKey column from client tools, as well as the SalesAmount column since we want only the measure to be used. In the DimEmployee table, we can also hide the EmployeeKey and ParentEmployeeKey columns.
You should end up with the following model:
Creating the Natural Hierarchy
With the use of DAX formulas and calculated columns, we will “naturalize” the parent-child relationship. First we need to construct the hierarchy path. This is the path between every leaf of the hierarchy and the root node. DAX has a function that does this for us: PATH. This function returns a delimited string with all of the identifiers of the parents of the current identifier right until the root node.
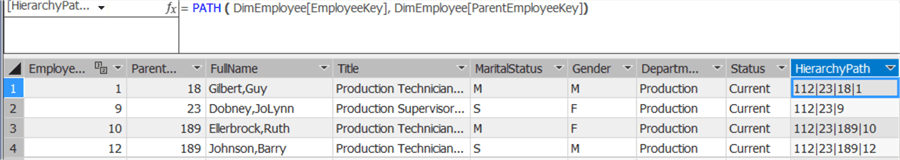
In the example above, we can see the result of the path function for employee ID 1. From right to left, we have ID 1 (the current employee), then 18 (the immediate parent, which you can verify in the ParentEmployeeKey column), then 23 and finally 112, which is the ID of the CEO of AdventureWorks.
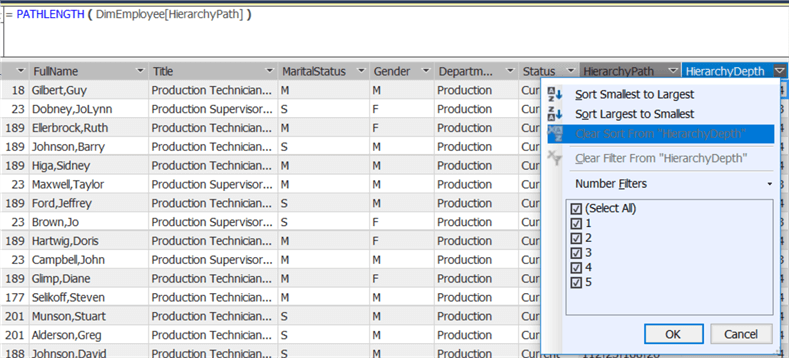
Now we know the path for each employee. But how do we know how many levels we need for our hierarchy? Using the PATHLENGTH function, we can count the number of levels traversed in the hierarchy path. In the resulting column, we just need to find the highest number, which is five in our case.
Finally we can create our hierarchy. Let’s start with the first level, the CEO. We use the LOOKUPVALUE function to retrieve the name of the employee using the first identifier of the hierarchy path. The first argument of LOOKUPVALUE is the column we wish to retrieve (the full name of the employee), the second argument is the column in which we need to search for a specific value and the third argument contains that specific value. This value is the identifier (EmployeeKey) of the employee we wish to retrieve. We can retrieve the identifier from the hierarchy path with the function PATHITEM.
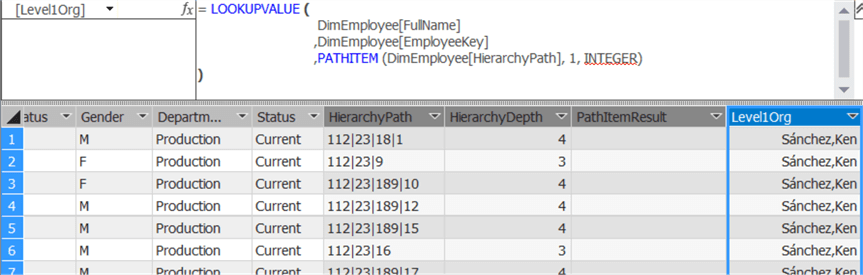
The PATHITEM function takes three arguments: the hierarchy path, the position we want to retrieve (the first in our case) and an optional argument that specifies the type of the result. This type can be either text or integer.
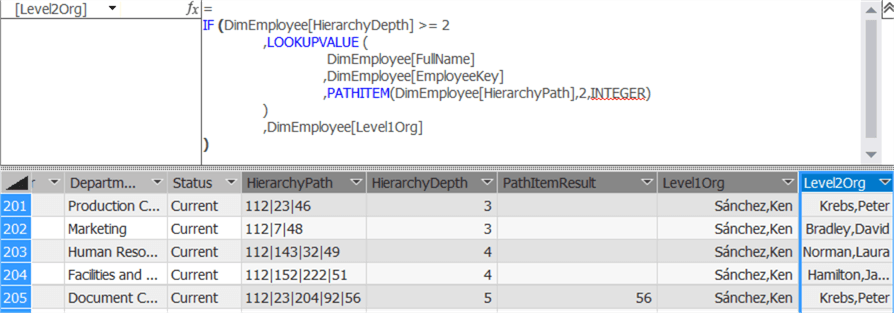
Let’s move on to the second level of the hierarchy. Now we adapt our formula for the calculated column slightly. We need to check if the employee is in the current level or even lower. We can do this by checking of the depth of the hierarchy is bigger or equal to the current level. If it is, we use the same formula as in level 1. If it isn’t, we need to repeat the value of the previous level.
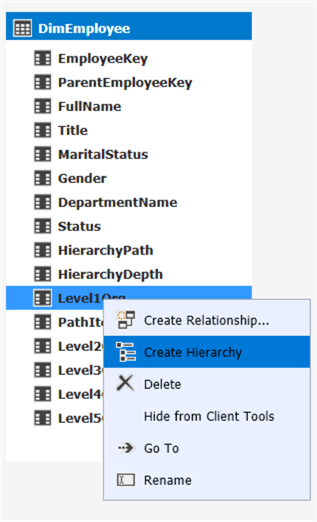
The formulas for level 3, 4 and 5 are similar to the formula of the level 2 column. Once all the calculated columns have been created, we can create a hierarchy in the model view. Right-click the level 1 column and choose Create Hierarchy.
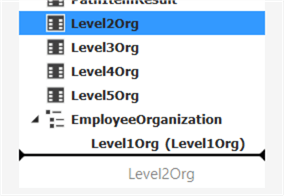
This will add a hierarchy at the bottom of the table, with level 1 as it’s only level. Rename the hierarchy to EmployeeOrganization. To add the second level, drag the Level2Org column right below the first level, as indicated in the screenshot:
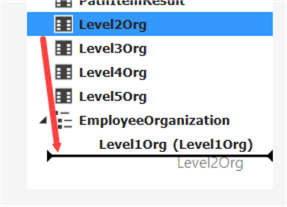
Make sure you don’t drag the level too far. If the black line spans the whole table width, you’ve dragged too far and the level won’t be added.
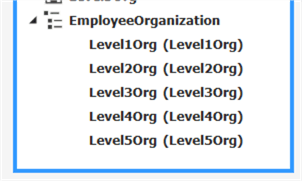
When all the levels have been added, we have the following hierarchy:
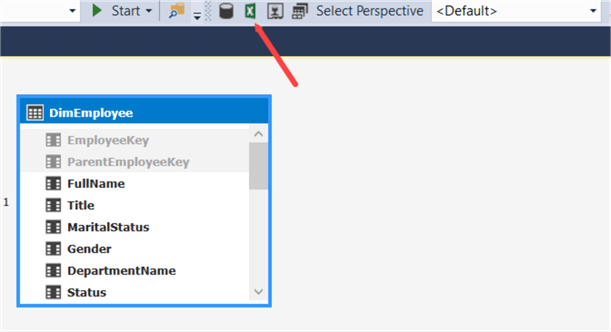
We can now test our hierarchy in Excel. You can launch Excel with a connection to your workspace model by clicking the Excel icon in the task bar:
There we can create the following pivot table to verify the hierarchy works:
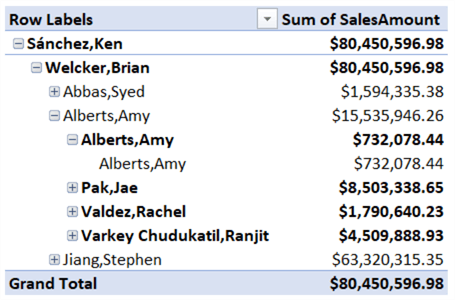
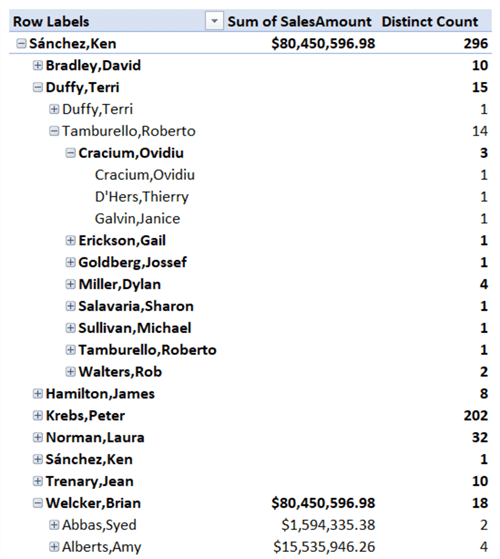
As you might notice, some members of the hierarchy are repeated – such as Alberts Amy – because the original parent-child hierarchy has leaf members at every level. Not all employees are shown, because not all employees are sales persons. By adding a distinct count on the EmployeeKey, we can visualize the entire hierarchy:
Conclusion
In this tip, we’ve shown how you can transform a parent-child hierarchy to a natural hierarchy using calculated columns in the Tabular model. The disadvantage of this method is that some members are repeated over different levels of the hierarchy, which can be confusing.
Next Steps
- If you want to take a look at the model and it’s DAX formulas, you can download it here. The solution was created with Visual Studio 2017 (SSDT version 15.4).
- A short tip on querying parent-child hierarchies using DAX: SQL Server DAX Parent Child Data.
- You can find more Analysis Services tips in this overview.


About the author
 Koen Verbeeck is a seasoned business intelligence consultant at AE. He has over a decade of experience with the Microsoft Data Platform in numerous industries. He holds several certifications and is a prolific writer contributing content about SSIS, ADF, SSAS, SSRS, MDS, Power BI, Snowflake and Azure services. He has spoken at PASS, SQLBits, dataMinds Connect and delivers webinars on MSSQLTips.com. Koen has been awarded the Microsoft MVP data platform award for many years.
This author pledges the content of this article is based on professional experience and not AI generated.
View all my tips
