By: Tim Smith | Comments | Related: > TSQL
Problem
We recently started using SQL Server for running queries against our regional data and one challenge we’re facing is comparing related data sets, following the principle of ceteris paribus (as similar as possible for our data). When we compare region A to region B, we want some of the variables to be as similar as possible, such as region A's weather being similar to region B's weather. Does SQL Server offer tools to compare related regional data, or are there ways to construct queries that allow us to compare these data by grouping similar data together for our comparisons?
Solution
If we have five variables that may differ among a data set, and we want to compare one or two of those variables while keeping the other variables as close to each other as possible (grouping related data), we’ll want to run a query that groups some variables together, though we’ll have to determine by what degree. Since we’re talking about regional data, it’s possible we could be comparing data by cost of living, climate, geography, etc.
In this tip, we’ll look at the first two and create patterns that we can use for other data sets. Using a region, we’ll group:
- Similar cost of living regions using contrived data and algorithms
- Similar summer climate data using a few examples across the United States
With the example involving cost of living, we’ll use an algorithm that ranks cost of living by a contrived measure. I use dynamic SQL for the function so that we can execute the entire batch at once - the function is not required, but we'll use the function as a demonstration of one way to solve this problem.
(Housing Cost x 25% + Food Cost x 15% + Healthcare Cost x 20% + Retirement Cost x 20% + Transportation Cost x 10% + Entertainment Cost x 10%)
This is not an applicable measure in numerous areas in reality, since some of these figures may not be applicable. For instance, people in a rural community may be able to produce their own food and while I treat retirement and savings as a cost, this is abnormal. This contrived algorithm will help us compare areas with similar ranks, but the algorithm itself could be a reflection of the region; for an example, some areas may have much higher housing costs which impact both transportation and retirement costs.
In the example involving climate, we’ll look at the two summer months of June and July and compare the average and median temperature. Rather than use an algorithm to determine values, we’ll use ranges:
Below 76
76 – 85
86 – 95
96 – 105
106 – 115
116 – 125
Above 125
Like the previous example, we could narrow or broaden these temperature ranges, depending on how close we want our comparison to be. These two examples will provide us with tools that help us compare data sets. In the first case, we have an algorithm that measures a region with a value so that we can compare regions with similar values. In the second case, we will compare regions in a similar range.
In our first example, we’ll create a table with non-existent cities and their respective rankings using the above arguments for our algorithm as columns and we’ll populate some data. We'll look at a query that uses the above algorithm and create a function using dynamic SQL solely for the purpose of single batch execution that uses this algorithm and returns the cost of living assessment. With this function and query, we take a low and high measurement range so that the latter query returns the values from the function that fit within that range.
CREATE TABLE tbMeasure(
   City VARCHAR(50),
   HousingMedianCost INT,
   FoodMedianCost INT,
   HealthcareMedianCost INT,
   RetirementMedianCost INT,
   TransportationMedianCost INT,
   EntertainmentMedianCost INT
)

INSERT INTO tbMeasure
VALUES ('City NE',250000,1000,30000,25000,2000,1000)
   , ('City NW',50000,200,2500,4000,300,0)
   , ('City SE',100000,700,15000,10000,900,200)
   , ('City SW',300000,1000,29000,22000,1500,1200)
   , ('City N',275000,2000,25000,30000,1800,500)
   , ('City S',60000,300,3100,5200,500,100)
   , ('City E',250000,1200,32000,28000,2100,1100)
   , ('City W',20000,100,1000,2500,100,0)

SELECT
   *
  ,(HousingMedianCost * 0.25) + (FoodMedianCost * 0.15) + (HealthcareMedianCost * 0.2) + (RetirementMedianCost * 0.2) + (TransportationMedianCost * 0.1) + (EntertainmentMedianCost * 0.1) CostofLivingAssessment
FROM tbMeasure

---- ONLY for example purposes using dynamic sql to execute in one batch
DECLARE @executesqlfordropping NVARCHAR(MAX)
SET @executesqlfordropping = N'
CREATE FUNCTION dbo.retCOLIndex (
   @HousingMedianCost INT,
   @FoodMedianCost INT,
   @HealthcareMedianCost INT,
   @RetirementMedianCost INT,
   @TransportationMedianCost INT,
   @EntertainmentMedianCost INT
)
RETURNS DECIMAL(13,2)
AS
BEGIN
   DECLARE @colindex DECIMAL(13,2)
   SET @colindex = (@HousingMedianCost * 0.25) + (@FoodMedianCost * 0.15) + (@HealthcareMedianCost * 0.2) + (@RetirementMedianCost * 0.2) + (@TransportationMedianCost * 0.1) + (@EntertainmentMedianCost * 0.1)
   RETURN (@colindex)
END'

EXEC sp_executesql @executesqlfordropping

DECLARE @low DECIMAL(13,2) = 70000, @high DECIMAL(13,2) = 90000
SELECT
   *
  ,dbo.retCOLIndex(HousingMedianCost,FoodMedianCost,HealthcareMedianCost,RetirementMedianCost,TransportationMedianCost,EntertainmentMedianCost) AS CostofLivingAssessment
FROM tbMeasure
WHERE dbo.retCOLIndex(HousingMedianCost,FoodMedianCost,HealthcareMedianCost,RetirementMedianCost,TransportationMedianCost,EntertainmentMedianCost) BETWEEN @low and @high
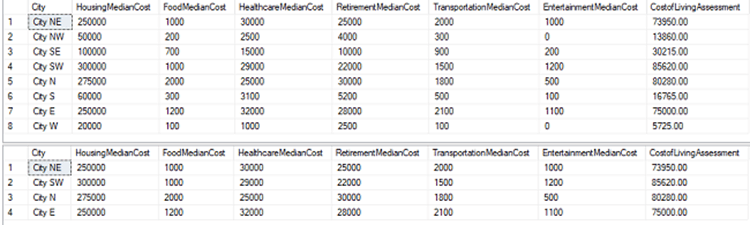
In the first query, we add the derived column. We create the function that uses this function by receiving the appropriate columns that make up the algorithm and return the cost of living assessment. From here, we can use cities with similar costs of living, if this is the overall variable that we want to keep as similar as possible. We could also add another step and assess a range based on the cost of living assessment (we will do this in the next example with temperature). Finally, if we want to keep our query for re-use we can add a final stored procedure that returns the city and cost of living assessment.
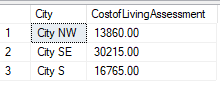
CREATE PROCEDURE stp_GetCityCOLIndex
@low DECIMAL(13,2)
, @high DECIMAL(13,2)
AS
BEGIN
   SELECT
      City
     ,dbo.retCOLIndex(HousingMedianCost,FoodMedianCost,HealthcareMedianCost,RetirementMedianCost,TransportationMedianCost,EntertainmentMedianCost) AS CostofLivingAssessment
   FROM tbMeasure
   WHERE dbo.retCOLIndex(HousingMedianCost,FoodMedianCost,HealthcareMedianCost,RetirementMedianCost,TransportationMedianCost,EntertainmentMedianCost) BETWEEN @low and @high
END

EXEC stp_GetCityCOLIndex 10000,35000
In our next example, we’ll pull average high temperature data for the months of June and July for ten large cities across the United States per US climate data. Next, we’ll use a range with a CASE-WHEN statement to asses these cities on a scale of a smaller number being the hottest temperature measured in Fahrenheit (126+) to a larger number being the coldest temperature measured in Fahrenheit (Below 76).
CREATE TABLE tbCity(
   City VARCHAR(25),
   MonthMeasure TINYINT,
   FahrenheitTemperature TINYINT,
)

INSERT INTO tbCity
VALUES ('New York City',6,80)
   , ('New York City',7,85)
   , ('Los Angeles',6,79)
   , ('Los Angeles',7,83)
   , ('Chicago',6,77)
   , ('Chicago',7,82)
   , ('Houston',6,88)
   , ('Houston',7,91)
   , ('Phoenix',6,104)
   , ('Phoenix',7,106)
   , ('Philadelphia',6,85)
   , ('Philadelphia',7,89)
   , ('San Antonio',6,92)
   , ('San Antonio',7,95)
   , ('San Diego',6,72)
   , ('San Diego',7,76)
   , ('Dallas',6,92)
   , ('Dallas',7,96)
   , ('San Jose',6,80)
   , ('San Jose',7,83)

SELECT
   City
  ,CASE
      WHEN FahrenheitTemperature < 76 THEN 1
      WHEN FahrenheitTemperature BETWEEN 76 AND 85 THEN 2
      WHEN FahrenheitTemperature BETWEEN 86 AND 95 THEN 3
      WHEN FahrenheitTemperature BETWEEN 96 AND 105 THEN 4
      WHEN FahrenheitTemperature BETWEEN 106 AND 115 THEN 5
      WHEN FahrenheitTemperature BETWEEN 116 AND 125 THEN 6
      WHEN FahrenheitTemperature > 125 THEN 7
   END AS TemperatureAssessment
FROM tbCity
WHERE MonthMeasure = 7
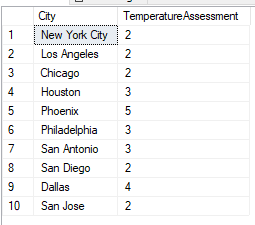
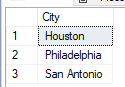
Our query returns the temperature assessments for the month of July using our temperature ranges. From here if we wanted to only look at cities with a temperature assessment of 3, we could add a subquery (or CTE) and filter further (see below example).
SELECT City
FROM (
      SELECT
         City
        ,CASE
            WHEN FahrenheitTemperature < 76 THEN 1
            WHEN FahrenheitTemperature BETWEEN 76 AND 85 THEN 2
            WHEN FahrenheitTemperature BETWEEN 86 AND 95 THEN 3
            WHEN FahrenheitTemperature BETWEEN 96 AND 105 THEN 4
            WHEN FahrenheitTemperature BETWEEN 106 AND 115 THEN 5
            WHEN FahrenheitTemperature BETWEEN 116 AND 125 THEN 6
            WHEN FahrenheitTemperature > 125 THEN 7
         END AS TemperatureAssessment
      FROM tbCity
      WHERE MonthMeasure = 7
) cetpar
WHERE cetpar.TemperatureAssessment = 3
In the same manner that we filtered cost of living assessments by a range, we created numerical categories for a range so that we could filter similar data by this numerical assessment. As we have more complex data and we're trying to achieve the data being as similar as possible for comparison, this is a useful technique as helps us filter quickly. Think of regional data where we want similar cost of living, similar weather data, similar geography, similar employment index rankings, etc. Once we find similar weather data, we still have to match those data with similar cost of living, geography, and employment index rankings. Numerically assessing a range can make this a faster process.
Next Steps
- Ask questions about how we want to look at data when we're structuring our data to match similar data and compare different data. Questions such as do we want to use buckets or ranges for categorical data? Can we convert some data values into categories, such as temperature or age ranges?
- While we look at two regional examples here, how we measure the data for comparing will matter. The measurements in these examples were either derived (cost of living assessment) or provided (temperature). Suppose that we had regional data which covered geography, such as mountains, canyons, hills, flatlands, etc. and we wanted to compare similar data using geography. How we take the next step to relate the data to each other becomes the first challenge.
- Consider that not all measurement assessments may not be similar, even if numbers imply they are. This is because some measurements are relative to the data point in question. An example of this is standard of living or happiness. Not everyone may have the same definition of standard of living, and not everyone values happiness in a given unit of time. Someone analyzing these data would have to apply their own assumptions of importance, value, etc.


About the author
 Tim Smith works as a DBA and developer and also teaches Automating ETL on Udemy.
This author pledges the content of this article is based on professional experience and not AI generated.
View all my tips
