By: Svetlana Golovko | Comments | Related: > SharePoint
Problem
Joining SharePoint lists in a SQL Server Reporting Services (SSRS) report could be tricky. There is a limitation in SSRS where you can use only one SharePoint list as a Data Source. In our last tip we provided steps to implement a workaround and combine data from 2 lists using lookup SharePoint columns. How else can we join the SharePoint lists?
Solution
This time we have a requirement to create the SSRS report that will help with SQL Servers upgrades and migrations planning.
SQL Server 2008 end-of-support date is coming this year (July 9, 2019). The end-of-support date for SQL Server 2012 is approaching fast and is in two years (July 2022). To plan and budget resources we would like to see how many servers, databases and applications are affected. We are going to use a couple SharePoint lists that have SQL Server inventory related information. We will also use end of support dates that are stored in a separate list.
To create our SSRS report we will need to use the "Microsoft SharePoint List" connection type in the report's Data Source. This tip has an example of the report that uses a SharePoint list as a Data Source.
Below are the steps to setup the SharePoint lists for our demo report and the steps to create the report.
Create SharePoint Lists
Create the SharePoint lists with SQL Servers and databases information as follows:
List #1 (Lifecycle): "_Demo: Products Support Dates". Add the following columns to the list:
- "Product Name" (Single line of text)
- "End of Support Date" (Date)
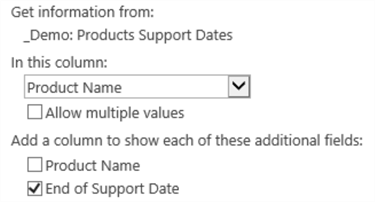
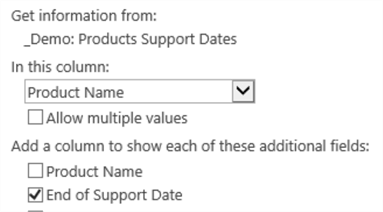
List #2 (Servers/Hosts list): "_Demo: SQL Servers". Add the following columns to the list:
- "Server Name" (Single line of text)
- "OS" (lookup to the "Product Name" reference column in List #1,)
- "OS:End of Support Date" (additional column in the lookup to the "Product Name" reference column in the List #1)
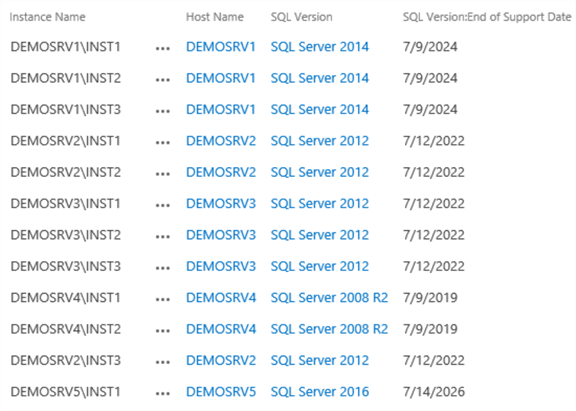
List #3 (Instances list): "_Demo: SQL Server Instances". Add the following columns to the list:
- "Instance Name" (Single line of text)
- "Host Name" (lookup to the "Server Name" column in the List #2)
- "SQL Version" (lookup to the "Product Name" column in the List #1)
- "SQL Version:End of Support Date" (additional column in the lookup to the "Product Name" reference column in the List #1)
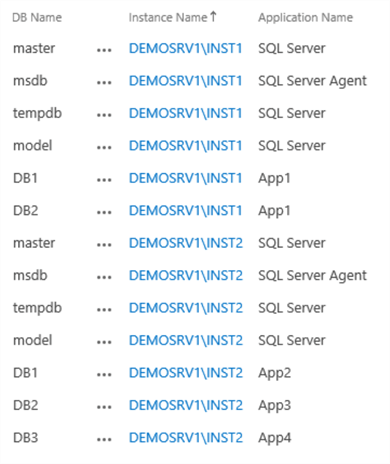
List #4 (Database Inventory list): "_Demo: Database Inventory". Add the following columns to the list:
- "DB Name" (Single line of text)
- "Instance Name" (lookup to the List #3)
- "Application Name" (Single line of text)
Note, that because the "SQL Version:End of Support" column in the "_Demo: SQL Server Instances" is already a lookup column in the Instances List we can’t use it here in the Database Inventory List. Lookup columns cannot be nested (created on another lookup column in a different list).
Populate the SharePoint lists
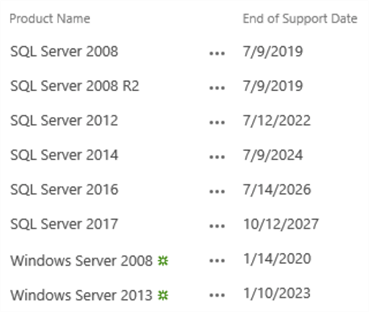
The Lifecycle list:
The Servers list:
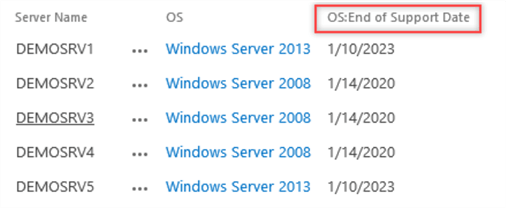
Note, that we didn’t have to enter the data for the highlighted column, it comes with the updated lookup column.
The Instances list:
The Database Inventory list (just part of it shown on the screenshot below, the full list is attached as Excel file at the end of this tip):
Create the SSRS Report using the SharePoint List Connection Type
We will use Report Builder to develop our report, but the steps using SQL Server Data Tools or Visual Studio will be almost the same. The output will be an *.rdl file that we can deploy to the Reporting Services Server.
We will start creating the report by defining a Data Source.
Select "Microsoft SharePoint List" as a connection type.
Enter a connection string for the SharePoint site that has your lists (that were created above).
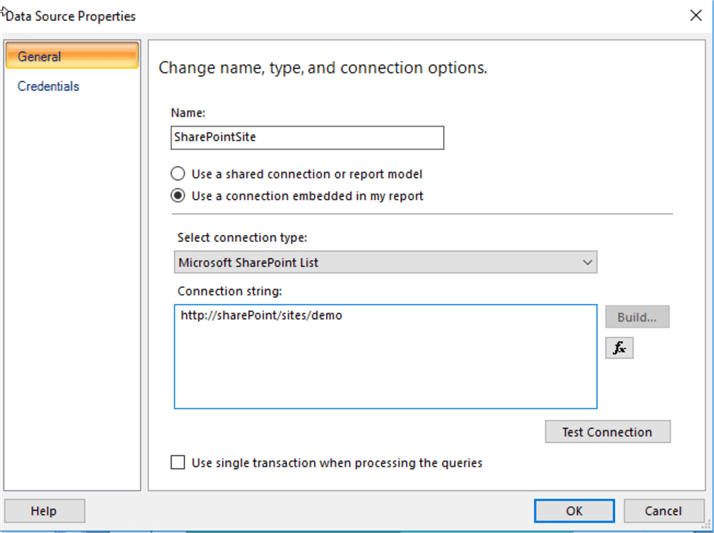
Select "Use current Windows user" under the "Credentials" settings.
Now we will create the following Datasets:
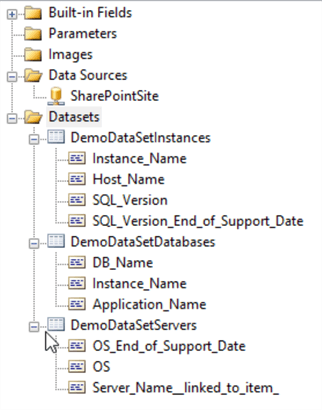
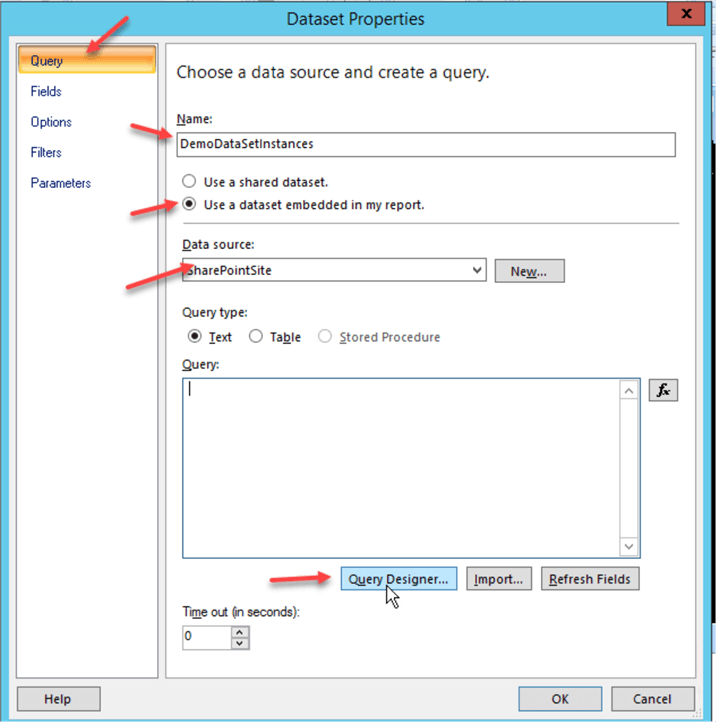
"DemoDataSetInstances" Dataset:
- Right click the "Datasets" folder under Report Data, click "Add Data Set…"
- Type the "DemoDataSetInstances" as the new Dataset name
- Select "Use a dataset embedded in my report"
- Use the Data Source that we have created earlier ("SharePointSite")
- Click "Query Designer"
- Select the "_Demo: SQL Server Instances" list and check the columns below:
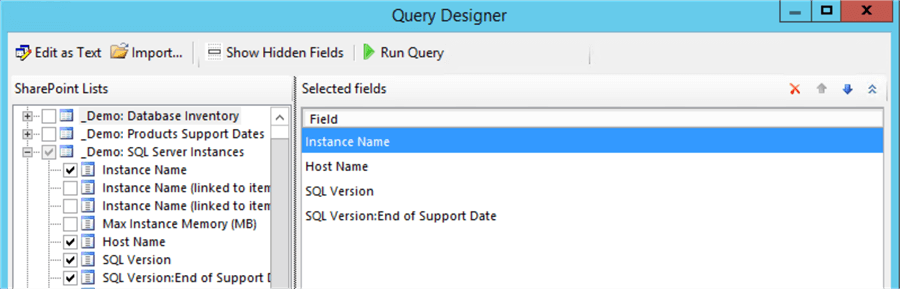
- Click "OK":
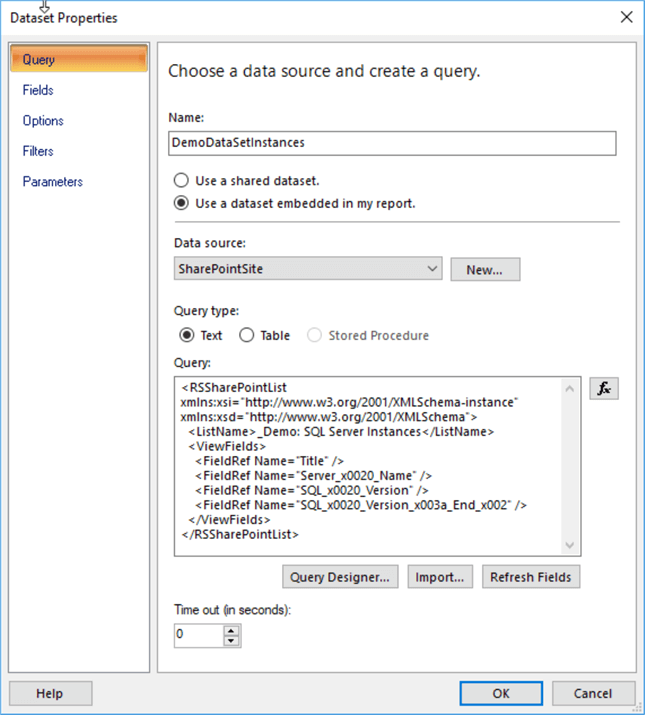
- Here is the query generated by the Query Designer:
<RSSharePointList xmlns:xsi="http://www.w3.org/2001/XMLSchema-instance" xmlns:xsd="http://www.w3.org/2001/XMLSchema">
  <ListName>_Demo: SQL Server Instances</ListName>
  <ViewFields>
    <FieldRef Name="Title" />
    <FieldRef Name="Server_x0020_Name" />
    <FieldRef Name="SQL_x0020_Version" />
    <FieldRef Name="SQL_x0020_Version_x003a_End_x002" />
  </ViewFields>
</RSSharePointList>
Note, that the field names above ("FieldRef Name") might be different in your case, but the Query Designer will generate the correct names for you.
Create the "DemoDataSetServers" Dataset with the columns selected below:
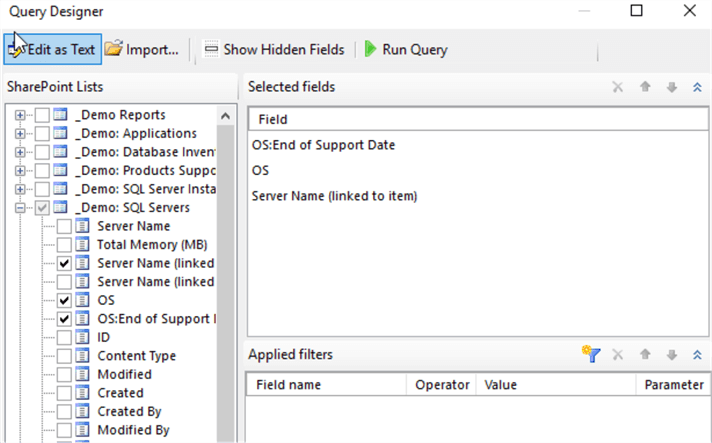
Here is the query generated by the Query Designer:
<RSSharePointList xmlns:xsi="http://www.w3.org/2001/XMLSchema-instance" xmlns:xsd="http://www.w3.org/2001/XMLSchema">
  <ListName>_Demo: SQL Servers</ListName>
  <ViewFields>
    <FieldRef Name="OS_x003a_End_x0020_of_x0020_Supp" />
    <FieldRef Name="OS" />
    <FieldRef Name="LinkTitleNoMenu" />
  </ViewFields>
</RSSharePointList>
Create the "DemoDataSetDatabases" Dataset:
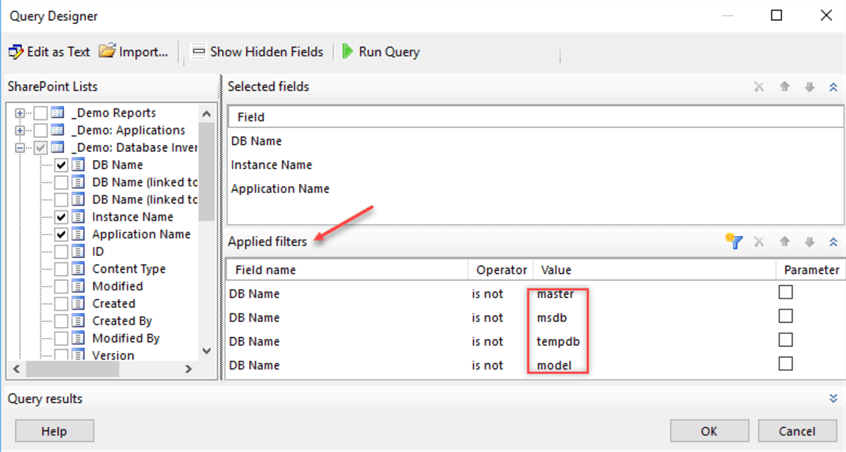
Note, that we don’t include into our report system databases, we only count users’ databases.
Here is the query generated by the Query Designer:
<RSSharePointList xmlns:xsi="http://www.w3.org/2001/XMLSchema-instance" xmlns:xsd="http://www.w3.org/2001/XMLSchema">
  <ListName>_Demo: Database Inventory</ListName>
  <ViewFields>
    <FieldRef Name="Title" />
    <FieldRef Name="Instance_x0020_Name" />
    <FieldRef Name="Application_x0020_Name" />
  </ViewFields>
  <Query>
    <Where>
      <And>
        <And>
          <And>
            <Neq>
              <FieldRef Name="Title" />
              <Value Type="Text">master</Value>
            </Neq>
            <Neq>
              <FieldRef Name="Title" />
              <Value Type="Text">msdb</Value>
            </Neq>
          </And>
          <Neq>
            <FieldRef Name="Title" />
            <Value Type="Text">tempdb</Value>
          </Neq>
        </And>
        <Neq>
          <FieldRef Name="Title" />
          <Value Type="Text">model</Value>
        </Neq>
      </And>
    </Where>
  </Query>
</RSSharePointList>
Create the Chart and Complete the Report’s Creation
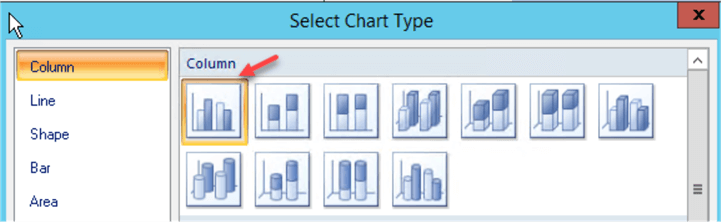
In the Report Builder insert the new Chart and select the "Column" chart type:
The main Dataset for our chart will be "DemoDataSetDatabases".
Click on the Chart and set the Chart Data as follows:
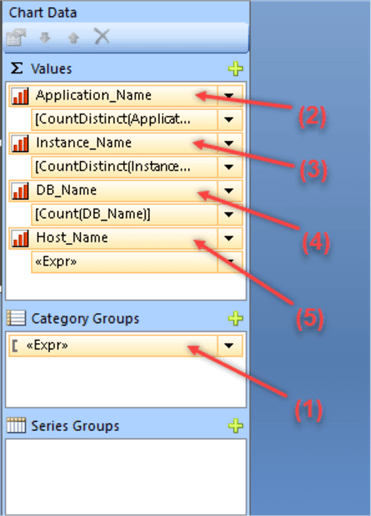
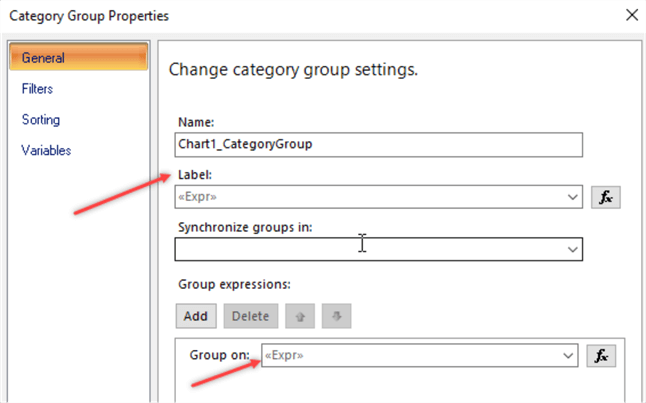
Chart Data Item (1) - "Category Groups". We will use a Year as our grouping value ("Group on:").
Note that this is the example of joining 3 SharePoint lists that we wanted to demonstrate:
1) The Chart’s Dataset uses the Databases list
2) We are getting "SQL_Version_End_of_Support_Date" value from the Instances list
3) But the actual value of the "SQL_Version_End_of_Support_Date" is in the third, Lifecycle list.
Use the following expression for the Label value (the format of the label will be "Year - SQL Server Version"):
Use the same expression for the sorting as for the grouping itself:
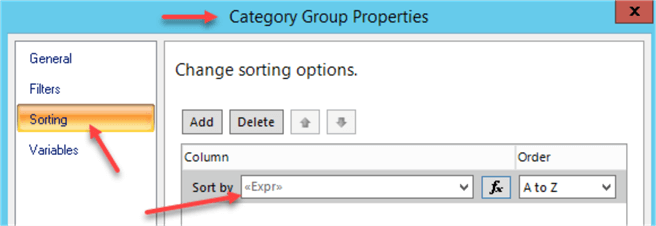
Chart Data Item (2) - "Application_Name" Series Value:
Click on the drop-down list next to the series we have created and select "Series Properties":
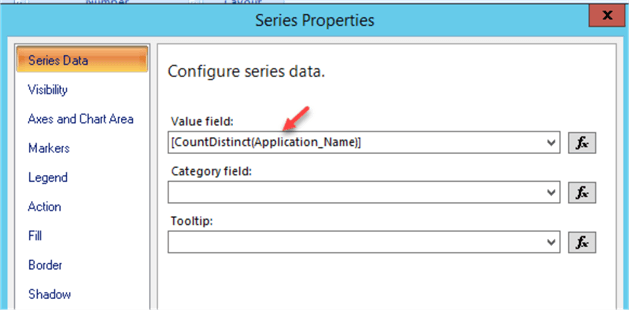
We are counting unique applications names. Some applications may have two or more databases, but at the end of the day this is going to be only a one upgrade/migration project for each application.
Set Custom Legend text ("Number of Applications") for the Series:
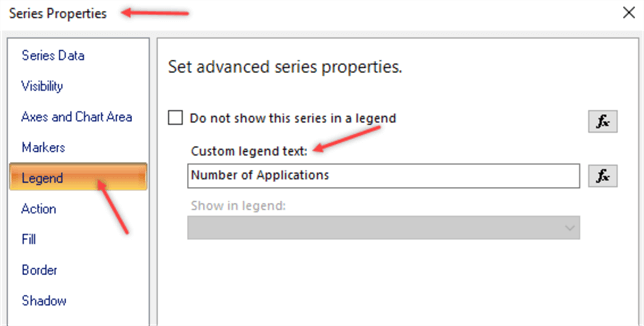
Chart Data Item (3) - add another Series Value ("Instance_Name" series) as the following expression:
=CountDistinct(Fields!Instance_Name.Value)
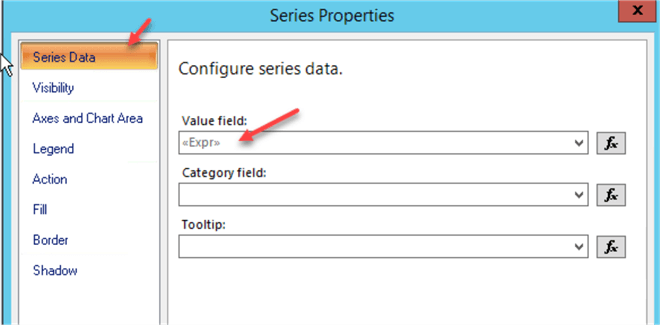
Set the Custom legend text: "Number of Instances".
Chart Data Item (4) - add another Series Value ("DB_ Name" series) as an expression:
=Count(Fields!DB_Name.Value)
Set the Custom legend text: "Number of Databases":
Chart Data Item (5) - add "Host_ Name" Series as the following expression:
Click "OK" and set the Custom legend text for the "Host_Name" series as "Number of Hosts".
Make the following changes to the Chart:
- Remove Vertical and Horizontal Axis Titles.
- Remove Chart Title (we will use report’s title instead).
- Remove Minor Gridlines for both Vertical and Horizontal Axis’s.
- Right click on each series bar on the chart and enable the "Show Data Labels" option.
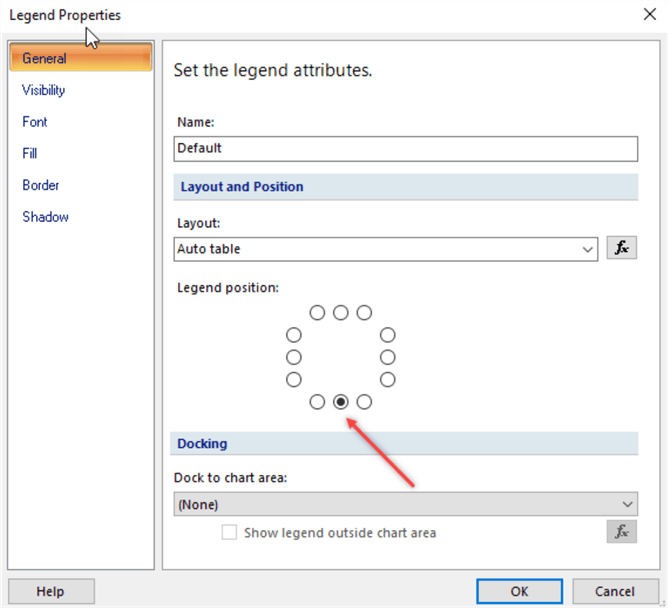
- Right click on the Legend and using the Properties move the Legend to the bottom middle:
The final report is going to look like this:
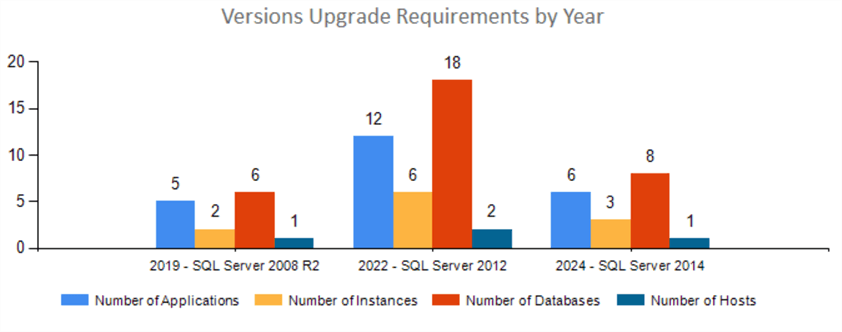
This chart is going to help us plan the following projects:
- In 2019 we are potentially going to have 6 projects (1 project to migrate 2 SQL Server 2008 instances and 5 projects to upgrade/migrate 5 applications)
- In 2022 we will have potentially 13 projects (1 of them to migrate 6 SQL Server 2012 instances and 12 to upgrade/migrate 12 applications)
- In 2024 we will have 7 projects (1 project to migrate 3 SQL Server 2014 instances and 6 to upgrade/migrate 6 applications).
As we can see in 2022 we may have the largest number of projects. We can start planning earlier and start some of the application upgrade/migration projects in 2020 and 2021.
Summary
This tip provided the step for the creation of the SSRS report with a timeline for upcoming end of support dates for the database servers and/or instances.
The SharePoint lists couldn’t be joined in the SSRS report the same way as SQL Server tables. We used the SharePoint lookup columns and the SSRS "Lookup" function in miscellaneous expressions to reference the second list and combine the data from three different lists. Nested lookups are not allowed, so we couldn’t add additional SharePoint list to our chart (to add Windows OS upgrade projects, for example).
You can probably achieve better, more flexible results for planning your upgrades if you use a report with SQL Server as a data source. But this tip and the previous tip give you some ideas on how to join SharePoint lists in a SSRS report and how to overcome SharePoint Data Source limitations.
Next Steps
- Create the report that will help you to plan your SQL Server migrations.
- Read other SharePoint tips here.
- Read Report Builder tips here.
- Download Sample Data for this tip
- This tip has another solution on joining SharePoint lists.


About the author
 Svetlana Golovko is a DBA with 13 years of the IT experience (including SQL Server and Oracle) with main focus on performance.
 This author pledges the content of this article is based on professional experience and not AI generated.
View all my tips
