By: Jim Evans | Comments (3) | Related: > Performance Tuning
Problem
Often, when analyzing and optimizing SQL Server query and stored procedure performance, the SQL Execution Plan tool in SQL Server Management Studio is relied on. Normally, in a production environment users and developers do not have the required security permissions to capture the execution plans. This leaves them with their hand tied and often relying on the Database Admins or troubleshooting in a lower environment where the conditions are normally not the same.
Solution
An alternative and a better first step when looking for bottlenecks is to use "SET STATISTICS IO ON". This can be done without escalated security. If you can run a query, you can look at the IO statistics.
I find that most of the time the STATISTICS IO output is extremely useful at identifying SQL query and stored procedure bottlenecks. The example below will show how to use STATISTICS IO to pinpoint the table bottleneck and quickly identify the issue by inspecting the query to find where best practices are not followed. I mocked up example queries from Microsoft's sample database WideWorldImporters. These examples are based on common issues that I have found over many years of troubleshooting query performance. The common issues are easy to identify once you know where to look.
Examples of High IO Queries in SQL Server
Let's look at two examples of high IO queries created using the sample database WideWorldImporters. We will first turn on STATISTICS IO, run the query and review the IO Statistics output looking at Logical Reads. We will then inspect the code to find any potential issues. Then we alter the query and test the results, showing improved statistics.
Note: The focus must be on Logical Reads which are reads from cache and are consistent each time the query is executed. Whereas, Physical Reads register reads of pages from disk and once the pages are cached there are no longer physical reads.
Example 1: High IO SQL Server Query – Function Hiding Column from Optimizer
The first example is one I see often when analyzing high IO queries. Run the query with SATISTICS IO on to capture and review the output and quickly identify the hot spot.
--First Set STATISTICS IO ON.
SET STATISTICS IO ON;

--Example 1: Poor performing High IO query
SELECT DATEADD(MONTH,DATEDIFF(MONTH,0,i.ConfirmedDeliveryTime),0) as 'Month',
      si.StockItemID,
      si.StockItemName,
      pt.PackageTypeName,
      c.ColorName,
      P.FullName,
      SUM(il.Quantity) as Total_Sold
FROM Warehouse.StockItems AS si
   LEFT JOIN [Warehouse].[Colors] as c on c.ColorID = si.ColorID
   INNER JOIN [Warehouse].[PackageTypes] as pt ON pt.PackageTypeID = si.OuterPackageID
   INNER JOIN [Sales].[InvoiceLines] as il ON il.StockItemID = si.StockItemID
   INNER JOIN [Sales].[Invoices] as i ON i.InvoiceID = il.InvoiceID
   INNER JOIN [Application].[People] p ON p.PersonID = i.SalespersonPersonID
WHERE LEFT(Convert(char(10),i.ConfirmedDeliveryTime,112),4) = '2016'
  AND p.IsSalesperson = 1
GROUP BY DATEADD(MONTH,DATEDIFF(MONTH,0,i.ConfirmedDeliveryTime),0),
   si.StockItemID,
   si.StockItemName,
   pt.PackageTypeName,
   c.ColorName,
   P.FullName
GO
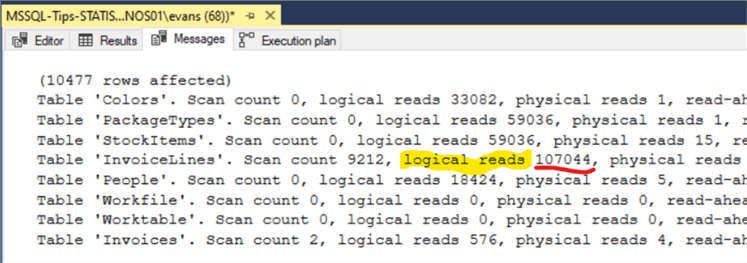
The STATISTICS IO output will be in the Messages tab in SQL Management Studio. Scanning the output, look for the highest Logical Reads. In this case the highest Logical Reads are 107,044 on the InvoiceLines table.
Solution – Look for functions in WHERE clause
The query only has 2 columns in the WHERE clause. Right away you can see that the main filter column is the ConfirmedDeliveryTime from the Invoices tables. So, why is there high IO on the InvoiceLines table and low IO on the Invoices table that has the main filtering criteria? Focusing on the Invoices ConfirmedDeliveryTime column that is a datetime data type and in this query wrapped in a function. Wrapping a column in a function prevents the use of that column by the Query Optimizer. Below is the Query modified removing the function around the ConfirmedDeliveTime column:
i.ConfirmedDeliveryTime between '2016-01-01 00:00:00.000' and '2016-12-31 00:00:00.000'
--First Set STATISTICS IO ON.
SET STATISTICS IO ON;

--Example 1: Simple correction to optimize a High IO query
SELECT DATEADD(MONTH,DATEDIFF(MONTH,0,i.ConfirmedDeliveryTime),0) as 'Month',
   si.StockItemID,
   si.StockItemName,
   pt.PackageTypeName,
   c.ColorName,
   P.FullName,
   SUM(il.Quantity) as Total_Sold
FROM Warehouse.StockItems AS si
   LEFT JOIN [Warehouse].[Colors] as c on c.ColorID = si.ColorID
   INNER JOIN [Warehouse].[PackageTypes] as pt ON pt.PackageTypeID = si.OuterPackageID
   INNER JOIN [Sales].[InvoiceLines] as il ON il.StockItemID = si.StockItemID
   INNER JOIN [Sales].[Invoices] as i ON i.InvoiceID = il.InvoiceID
   INNER JOIN  [Application].[People] p ON p.PersonID = i.SalespersonPersonID
WHERE i.ConfirmedDeliveryTime between '2016-01-01 00:00:00.000' and '2016-12-31 00:00:00.000'
  AND p.IsSalesperson = 1
GROUP BY DATEADD(MONTH,DATEDIFF(MONTH,0,i.ConfirmedDeliveryTime),0),
   si.StockItemID,
   si.StockItemName,
   pt.PackageTypeName,
   c.ColorName,
   P.FullName
GO
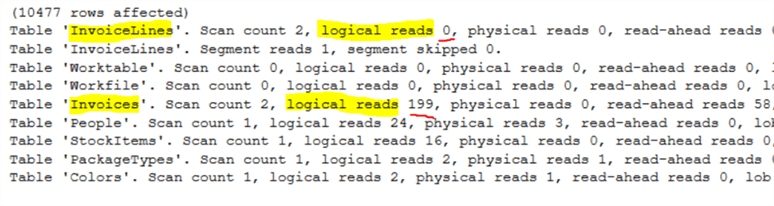
Reviewing the STATISTICS IO output, we see a significant improvement resulting is a nicely fine-tuned query. We see now the Logical Reads highest IO is now on the Invoices table as expected and the InvoicesLines table Logical Read now reduced from 107,044 to 0! All other tables are also showing significant lower Logical Reads. Reworking the filter column in the WHERE clause by removing the function did the trick allowing the optimizer to pick an index on that column.
Example 2: High IO SQL Server Query – Bad Parameter Data Type
Example 2 is another query that I see often when analyzing high IO queries. Review the query and the IO output to quickly identify the hot spot.
SET STATISTICS IO ON;
--Example 2: Poor performing High IO query
SELECT il.InvoiceID,
   o.[CustomerPurchaseOrderNumber],
   i.ConfirmedDeliveryTime,
   si.StockItemID,
   si.StockItemName,
   pt.PackageTypeName,
   c.ColorName,
   P.FullName,
   ol.Quantity,
   il.Quantity
FROM [Sales].[Orders] o
   INNER JOIN [Sales].[OrderLines] ol ON ol.OrderID = o.OrderID
   INNER JOIN Warehouse.StockItems AS si on si.StockItemID = ol.StockItemID
   LEFT JOIN [Warehouse].[Colors] as c on c.ColorID = si.ColorID
   INNER JOIN [Warehouse].[PackageTypes] as pt ON pt.PackageTypeID = si.OuterPackageID
   INNER JOIN [Sales].[InvoiceLines] as il ON il.StockItemID = si.StockItemID
   INNER JOIN [Sales].[Invoices] as i ON i.InvoiceID = il.InvoiceID and i.[OrderID] = o.[OrderID]
   INNER JOIN  [Application].[People] p ON p.PersonID = i.SalespersonPersonID
WHERE o.[CustomerPurchaseOrderNumber] = 12337
   AND i.ConfirmedDeliveryTime between '2016-01-01' and '2017-01-01'
   AND p.IsSalesperson = 1
GO
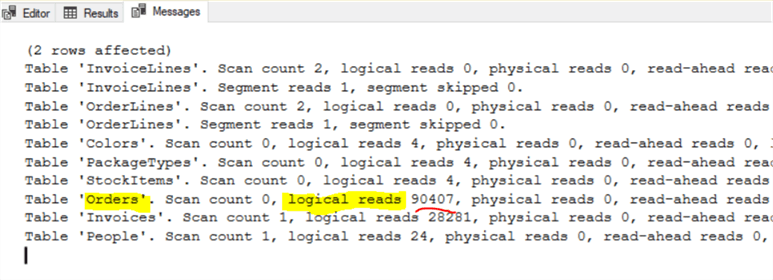
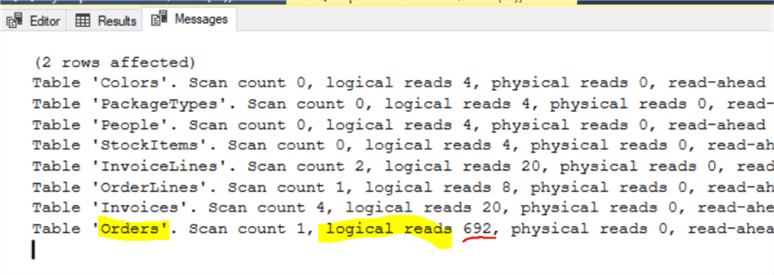
In example 2 reviewing the STATISTICS IO output shows that the Order Table is the bottleneck with Logical Reads of 90,407. Because we are passing the Order table CustomerPurchaseOrderNumber filtering parameter we review indexes on the Order table and see that we do not have an index on the CustomerPurchaseOrderNumber. Working with a sample database we can test to see if an index will help.
Solution – Create an Index on Orders.CustomerPurchaseOrderNumber
Run the following code to create an index on the Order Table. Then re-run the Example 2 query above and review the STATISTICS IO results.
USE [WideWorldImporters]
GO

SET ANSI_PADDING ON
GO

/****** Object:  Index [Jim_NonClusteredIndex-CustomerPurchaseOrderNumber]    Script Date: 8/18/2019 4:37:53 PM ******/
CREATE NONCLUSTERED INDEX [MSSQLTips_NonClusteredIndex-CustomerPurchaseOrderNumber] ON [Sales].[Orders]
(
   [CustomerPurchaseOrderNumber] ASC
)WITH (PAD_INDEX = OFF, STATISTICS_NORECOMPUTE = OFF, SORT_IN_TEMPDB = OFF, DROP_EXISTING = OFF, ONLINE = OFF, ALLOW_ROW_LOCKS = ON, ALLOW_PAGE_LOCKS = ON) ON [USERDATA]
GO
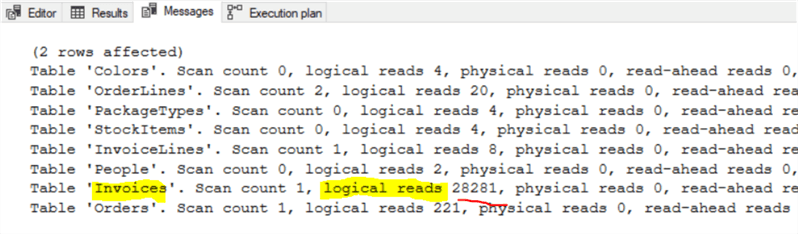
Reviewing the Example 2 results with the new index on the Orders table CustomerPurchaseOrderNumber column, it still shows a query that is not fully optimized. The results now show high Logical Reads on the Invoices table.
Solution – Make sure data types match
In Example 2 after creating the Index on the Orders table CustomerPurchaseOrderNumber column we still see high IO Logical Reads on Invoices. Why is the optimizer favoring the Invoices table ConfirmedDeliveryTime column over the more obvious index on the Orders table CustomerPurchaseOrderNumber column index that was just created? Let's check the data types between CustomerPurchaseOrderNumber column and the parameter.
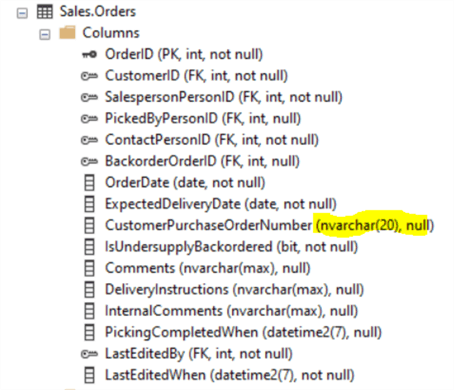
Orders.CustomerPurchaseOrderNumber is a nvarchar data type! We are passing the filtering parameter as an integer value. Let's try again passing the parameter as a matching data type: o.[CustomerPurchaseOrderNumber] = N'12337'.
SET STATISTICS IO ON;
--Example 2: Poor performing High IO query
SELECT il.InvoiceID,
   o.[CustomerPurchaseOrderNumber],
   i.ConfirmedDeliveryTime,
   si.StockItemID,
   si.StockItemName,
   pt.PackageTypeName,
   c.ColorName,
   P.FullName,
   ol.Quantity,
   il.Quantity
FROM [Sales].[Orders] o
   INNER JOIN [Sales].[OrderLines] ol ON ol.OrderID = o.OrderID
   INNER JOIN Warehouse.StockItems AS si on si.StockItemID = ol.StockItemID
   LEFT JOIN [Warehouse].[Colors] as c on c.ColorID = si.ColorID
   INNER JOIN [Warehouse].[PackageTypes] as pt ON pt.PackageTypeID = si.OuterPackageID
   INNER JOIN [Sales].[InvoiceLines] as il ON il.StockItemID = si.StockItemID
   INNER JOIN [Sales].[Invoices] as i ON i.InvoiceID = il.InvoiceID and i.[OrderID] = o.[OrderID]
   INNER JOIN  [Application].[People] p ON p.PersonID = i.SalespersonPersonID
WHERE o.[CustomerPurchaseOrderNumber] = N'12337'
   AND i.ConfirmedDeliveryTime between '2016-01-01' and '2017-01-01'
   AND p.IsSalesperson = 1
GO
Reviewing the STATISTICS IO output, we now see a significant improvement. We see the highest Logical Reads IO is now on the Orders table as expected. Though the Logical Reads are much lower across the entire query. The optimized STATISTICS IO results show the Invoices table Logical Reads reduced from 28,281 to 20 with Logical Reads on the Orders table only 692! By using the correct datatype parameter, we have successfully optimized another query.
Conclusion
Using STATISTICS IO can be and easy way to pinpoint queries with high IO hot spots. It is a good first step to quickly identify possible issues resulting in poor performing queries and stored procedures. Execution plans are also a great tool and can be used along with STATISTICS IO results to get details about queries. However, many users may not have permissions to use Execution Plans or they may find Execution Plans overwhelming. Often, I find issues with poor performing queries using just STATISTICS IO.
Another statistics setting is SET STATISTICS TIME ON which will show CPU time in milliseconds. I use this when I want to add additional evidence showing the possible query optimization. Typically, high IO results in High CPU, so you don't really need both to find your bottleneck.
Notes about Microsoft schemas: You may notice the STATISTICS IO results do not include the table schema name. Usually this is not an issue unless you have the same table name under multiple schemas. If so, you will need to guess which table the IO belongs to. Hopefully one day Microsoft will include the Schema name with the table name in the STATISICT IO results!
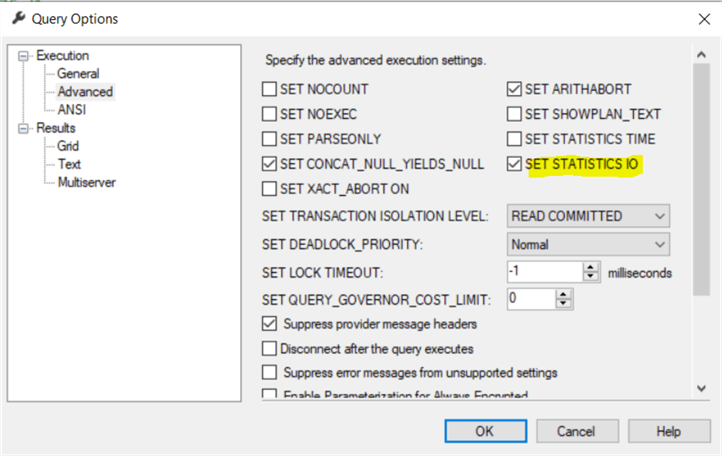
Other ways to turn on STATISTICS IO is via Query Options in SQL Server Management Studio:
Next Steps
- To find the free WorldWideImports sample database do a web search on "WideWorldImporters download".
- Read Getting IO and time statistics for SQL Server queries
- Read Query Execution Plans
- Read SQL Server Execution Plan Overview
- Read Introduction to SQL Server Query Optimization with Database Engine Tuning Advisor


About the author
 Jim Evans is an IT Manager currently for Crowe who has managed DBA, Developer, BI and Data Management teams for over 20 years.
This author pledges the content of this article is based on professional experience and not AI generated.
View all my tips
