By: Sadequl Hussain | Comments | Related: > Amazon AWS RDS
Problem
Amazon RDS SQL Server now supports Performance Insights. How can we use it to troubleshoot SQL Server performance bottlenecks?
Solution
The Need for a Better Troubleshooting Tool
Amazon Web Services’ (AWS) managed database platform, RDS, frees up most DBAs from installing, configuring, patching or backing up database servers. For troubleshooting RDS performance issues, DBAs often rely on the CloudWatch platform which offers a rich set of metrics, alerts and dashboarding facilities.
Until recently, Amazon offered two ways to report RDS database performance:
- CloudWatch metrics for RDS
- RDS enhanced monitoring
CloudWatch metrics show infrastructure-related counters like CPU, network throughput, IO performance or disk queue length of the underlying virtual machine or its host. Enhanced monitoring on other hand, exposes operating system metrics like free memory available or currently running processes.
Although these are useful for identifying resource contention, SQL Server DBAs still need to dig deeper to find problem queries. Troubleshooting a slow running RDS SQL instance would usually start with the DBA quickly having a look at these counters for an idea about of the system’s overall health. This would be followed by checking currently running queries and statements. Then system tables, dynamic management views or functions would be queried for further analysis. All these pieces of information and data from other sources like log files would be then correlated to get to the root cause. Depending on the complexity of the problem, this can easily take anywhere between several minutes to several hours, to even days. Third-party monitoring solutions can simplify this process, but that means paying for a solution.
Unfortunately, with the rise of modern distributed applications, the time for troubleshooting slow performance has shrunk dramatically. Today, ops teams, DevOps engineers, developers and DBAs are all responsible for troubleshooting database performance problems. When the database a performance goes down, everyone tries to find a quick answer to one single question: what’s the query that’s slowing down the server? To make things worse, there may not be a dedicated DBA in the team, forcing non-DBAs to look for the answer.
Amazon realized this and came up with a third method of troubleshooting RDS database performance: Performance Insights.
What’s Amazon RDS Performance Insights?
Performance Insights is an Amazon RDS feature that can automatically analyze the current workload of a database instance and identify the queries that are slowing it down. For each query, it can show the type of wait it’s causing, the user who is causing the slowness or the client machine that’s running the query. All this information is made available in a compact, easy-to-understand dashboard, which makes Performance Insights a great tool for troubleshooting.
To get this kind of information, Performance Insights queries the RDS instance’s internal data structures in memory once every second. It’s not a disk-based operation, so the sampling does not put any pressure on the system. Later, we will talk about the types of data that’s collected during the samplings.
How to Enable RDS Performance Insights
By default, Performance Insights is enabled when a new SQL Server RDS instance is created. It can be also enabled for existing instances. To enable Performance Insight, edit the SQL Server RDS instance’s property, and select the "Enable Performance Insights" option:
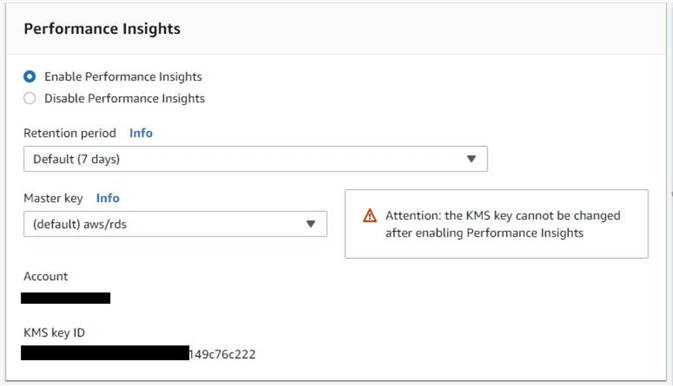
The default retention period for Performance Insights data is 7 days. That’s the time RDS allows to keep the data without any charges. You can choose to go beyond this window for an extra price. To know more about the extra cost, visit the AWS RDS Performance Insights pricing page.
The default KMS key for encrypting Performance Insights data is aws/rds. You can also use your own KMS key. Regardless of the method you choose, once you set the master key, it can’t be changed.
How to Access AWS RDS Performance Insights
There are two ways to access the Performance Insights console.
The first method is to click on the "Performance Insights" link in the RDS console navigation pane:
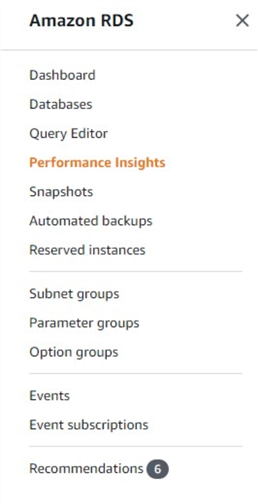
This opens the Performance Insights console with a list of DB instance it’s enabled in.
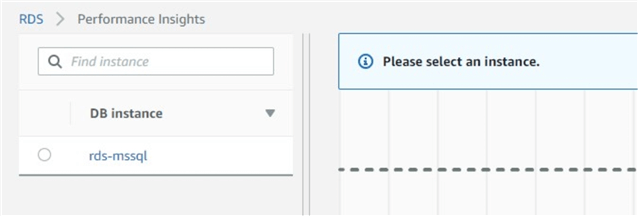
Clicking an instance name will open its dashboard in the console.
The second method is to go to the "Databases" page of the RDS console and from the list of RDS instances, click on the bar graph under the "Current Activity" column. In the image below, note how the bar graph is visible for the MSSQL instance, but not the MySQL one. This means Performance Insights has been enabled for the SQL instance only.

A Brief Walk-through of Performance Insights
When you see a Performance Insights dashboard, you will notice a few different items in the screen:
- The labels "Database load" and "Average Active Session" in top left corner
- A timeframe picker near top right corner
- A stacked graph in the middle of the screen
- On the right side of the graph, a list of color-coded items, typically listed under "Wait"
- Under the graph, a series of bars in decreasing order of length, also color-coded, under the heading "Load by Waits (AAS)"
- A SQL statement against each bar
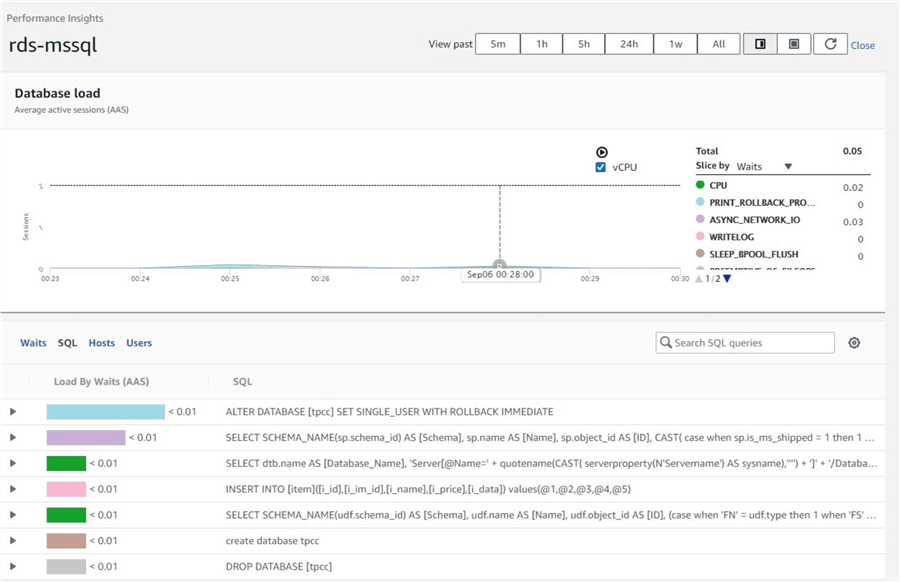
To make sense of it all, let’s get familiar with a few things.
Unlike traditional systems that expose a series of metrics, designers of Performance Insights wanted to keep things simple. With Performance Insights, only one metric is exposed, called the database load. The idea behind this simplicity was, people should not be relating multiple metrics to get to the bottom of a problem: they should be looking at a single metric and understand how "loaded" the server is and more importantly, what’s causing that load.
The database load is expressed in terms of something called the Average Active Sessions (AAS).
Previously we mentioned that Performance Insights collects information about an RDS instances by polling it once every second. This polling happens in the RDS instance’s memory, against a specialized data structure. The main information that’s collected during these samplings is the number of active sessions running on the instance. By "active", we mean connections that are in the middle of doing something, like running a query, modifying some data or waiting for a lock and so on. For each active session, Performance Insights also collects a series of status information, like the SQL statement that’s running, the user that’s running the session, the client address where it’s coming from, the current state of the session, and so on.
For large, complex operations, active sessions can span across longer intervals, spanning across multiple samplings. Then there are small, quick operations that may be transient in nature. These sessions start and finish either between two samplings or span across only a few samplings. And then again, there may be samplings when no sessions are active.
The number of active sessions from these samplings are then aggregated and averaged over 1-minute intervals. This is Average Active Sessions (AAS), the metric used to express the database load. The higher the AAS, the heavier the server is loaded, because it means more session are running on it.
The graph in the upper half of the Performance Insights dashboard shows the AAS over time. By default, last 1 hour’s AAS trend is shown in the graph, but the time window can be chosen from top right corner of the screen. You can report from last 5 minutes to last 1 week, or all time. Also, if you hold and drag your mouse over the graph, it will be expanded and show a more granular level of the AAS over time.
How to Interpret Database Load in Performance Insights
Now, for a metric to be meaningful, it must be compared against some threshold. When the metric is consistently above this threshold, we know the system is performing badly. When it’s below that threshold, we know the system is performing alright.
In RDS Performance Insights, that threshold is the number of vCPUs of the RDS instance.
The use of vCPUs as a threshold makes sense, because at any one time, a CPU core can service only one active session. If the number of Average Active Sessions are consistently high above the number of vCPUs, it means there’s some bottleneck in the system.
So, this means if your RDS instance has 4 vCPUs, you would want the database load to be under 4 Average Active Sessions. As an example, in the image below, we can see the RDS instance has 2 vCPUs. There are a few spikes in the last 5 minutes, but the overall load is almost zero.

How to Find Root Cause of Slowness from Performance Insights
Now that you know the system is under heavy load, and can see the number of average active sessions over the threshold, the next logical question comes up: what’s causing that load?
To show the answer, Performance Insights allows you to slice and dice the database load by any two attributes from the following list:
- Wait: the wait type for a resource, like CPU, IO, network or lock
- SQL: the SQL command that’s running
- Host: the client machine that’s running the query – this can be a user’s desktop or an app server
- User: the user who is running the query
You can choose any of these dimensions from the right side of the performance graph:
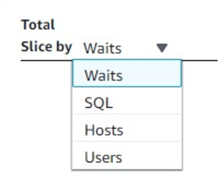
For a given database load, we can slice that load by say, wait types. The list on the right side of the dashboard will show different types of waits causing that load. Each wait type will have a color legend to identify it.
As an example, in the image below, we can see the system is not loaded at all except for a few spikes in CPU waits. However, at some point we have three types of waits together, all causing a bit of loading on the server. There’s waiting for CPU, followed by WRITELOG, which is the type of wait related to flushing data to transaction log. This is followed by a wait type related to database backup and restore. As soon as the backup or restore finishes, the system goes back to normal.

In the bottom half of the screen, you can choose a second attribute like "SQL" to show the top SQL commands causing these wait types. For each SQL command, Performance Insights shows a bar, color-coded as the wait type, with its length representing the load on the server. In other words, what Performance Insights is telling you here is: "these are your top SQL commands in the instance, and these are the loads they are putting on the server. And for each SQL statement, you can see the type of wait the load is made up of.

In the image above, we can see the maximum load is caused by the SQL statement "RESTORE DATABASE". This command is causing a wait type of "BACKUPTHREAD" depicted by the pink color.
Although each bar here shows a single wait type, there may be cases where a SQL statement is causing multiple types of waits. In such cases, the corresponding bar will show all the wait types split by their color codes.
As another example, let’s consider this busy RDS instance:
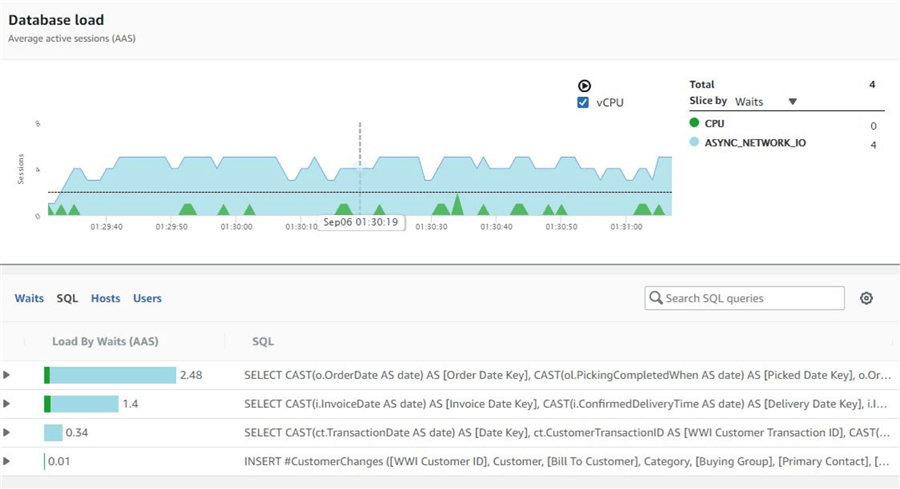
We can see the top two SQL statements are causing two types of waits: CPU and ASYNC_NETWORK_IO, with the latter causing most of the load. According to Microsoft documentation, ASYNC_NETWORK_IO:
"Occurs on network writes when the task is blocked behind the network. Verify that the client is processing data from the server".
What this basically means is the session is waiting for an acknowledgement from the client application that it has consumed the data it was sent, and the session can go ahead and process more data. Without this acknowledgement, the client keeps waiting, increasing the load on the instance.
Once you have this kind of information at hand, the rest is easy. All you have to do is zero-in on that SQL statement: where is it coming from, what is it trying to do, whether it’s blocking any other session and so on.
Just like top SQL, you can choose to dice the load by users or hosts.
When you choose "Users", Performance Insights will show the users causing the most loading on the server and types of waits they are causing. When you choose "Hosts", you can see the client machines responsible for the loading and the type of waits they are causing. For the ASYNC_NETWORK_IO wait for example, we could dice by hosts and see which client are responsible this wait. We could then investigate if the client connection is behind a firewall, or if the network bandwidth is enough. To rule out any network saturation at the RDS end, we could also check the NetworkReceiveThroughput or NetworkTransmitThroughput CloudWatch metrics for the RDS instance.
Before wrapping up, here is another tip
You don’t always need to go to the Performance Insights console to see if a database instance is under load. In fact, you can check the little bar under the "Current activity" column in the RDS instance to see if there is any loading. This bar shows the CPU threshold as a red line in it. As the server is loaded, the bar fills up with blue. When the average active sessions reach the threshold, the color turns to red. You can have a quick look at the instance’s current activity bar and see how far the load is above threshold.
In the image below our SQL Server RDS instance is under heavy load. It’s running 5.6 average active sessions and that number has already crossed the vCPU threshold:

Final Words
Having something like Performance Insights in the toolbox is certainly an advantage for whoever is managing your RDS SQL Server. However, this is a reactive tool, which means you use Performance Insights only when there is a performance problem, or you are retrospectively investigating an issue. Such cases should be minimal if you are proactively monitoring your RDS SQL Servers with CloudWatch alerts, event notifications etc.
Another use of Performance Insights can be related to scaling. If you see the AAS load for an instance is almost always near to the bottom of the graph, you may want to check server’s configuration and what’s running in it. Scaling down such instances can save costs.
Similarly, if you see a perpetual performance problem for an instance even after you have fine-tuned all SQL queries, it may be worthwhile to upgrade it to a higher instance class.
Also, when you see a sudden performance problem after a new application or database change has been rolled out, you can select the top SQL queries option to identify the objects and queries causing the load. You can then review those queries to see if they were part of the change.
Next Steps
- Learn more about Performance Insights from the AWS Online Tech Talks video in YouTube.
- Start enabling Performance Insights for your non-production database fleet and use it to identify any under-performing or over-spec’d instance. Follow the lessons learned for production systems.
About the author
 Sadequl Hussain has been working with SQL Server since version 6.5 and his life as a DBA has seen him managing mission critical systems.
This author pledges the content of this article is based on professional experience and not AI generated.
View all my tips


