By: Rick Dobson | Comments (1) | Related: > Functions System
Problem
In this tip we look at different examples of getting random values using the SQL Server RAND function to give you a better idea of how this works and when and how to use it.
Solution
The SQL Server RAND function allows you to generate a pseudo-random sequence of numbers. The Microsoft SQL Docs site presents basic examples illustrating how to invoke the function. A pseudo-random sequence is one that is determined according to precise rules, but which appears to be random. The values are often uniformly random over some range of values. The SQL Server RAND function generates pseudo-random numbers of this sort. MSSQLTips.com offers several prior tips comparing the RAND function to other ways of generating pseudo-random sequences and demonstrating extensions to the RAND function (here, here, and here). This tip focuses on the basics of how to invoke the function especially highlighting the role of seed values along with coordinated demonstrations.
Basic Operation of the RAND function
The RAND function operates with or without the specification of a seed value that can determine the ability to repeat a sequence of output values. With or without a seed, the function returns a value from 0 through 1, exclusive. The return type from the function has a float data type. If the seed value is identical for successive invocations of the function, then the return value is the same for each successive run of the function. Seed values can have any of the following three data types: tinyint, smallint, int. If you do not specify a seed when invoking the function, then a random seed value is assigned in the background for each invocation of the function.
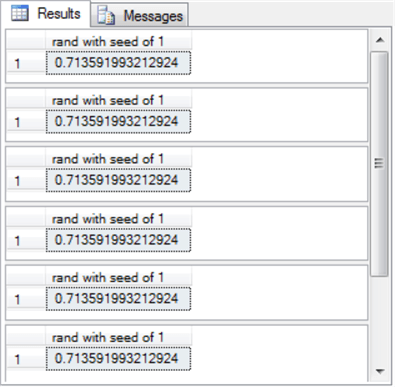
The following example shows the syntax for running the function six successive times with the same seed value (1) for each invocation.
-- initial run
select rand(1) [rand with seed of 1]

-- rand with same seed
select rand(1) [rand with seed of 1]

-- rand with same seed
select rand(1) [rand with seed of 1]

-- rand with same seed
select rand(1) [rand with seed of 1]

-- rand with same seed
select rand(1) [rand with seed of 1]

-- rand with same seed
select rand(1) [rand with seed of 1]
The output from the preceding script shows the returned values. Each return value is the same because each select statement relies on the same seed value of 1. The function’s output appears as a float value (0.713…).
If you specify a seed value just for the initial invocation of the RAND function and follow that by five more invocations of the function without a seed, then you can retrieve a repeatable list of pseudo-random values. The list is repeatable in the sense that re-running a script returns the same list of pseudo-random values.
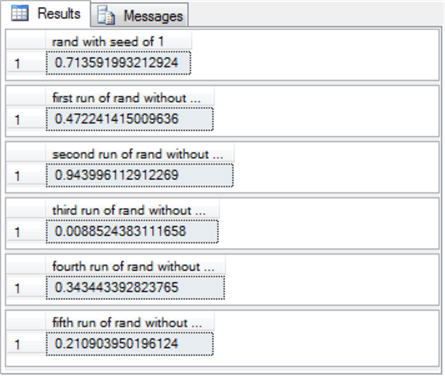
Here’s a script that shows an initial RAND function invocation with the same seed as in the preceding script. However, the initial invocation is followed by five additional RAND functions invocations without a seed value.
-- initial run
select rand(1) [rand with seed of 1]

select rand() [first run of rand without seed]

select rand() [second run of rand without seed]

select rand() [third run of rand without seed]

select rand() [fourth run of rand without seed]

select rand() [fifth run of rand without seed]
The following table shows the results sets from two consecutive runs of the preceding script. Notice that each run returns the exact same sequence of values. This output confirms that the list output by the script repeats the same sequence of pseudo-random values. The feature keeping the results the same across consecutive runs is the seed value for the first invocation of the RAND function. If you change the seed value for the initial invocation of the RAND function, then the pseudo-random sequence in the results set also changes.
| Results set from first run of preceding script | Results set from second run of preceding script |
|
|
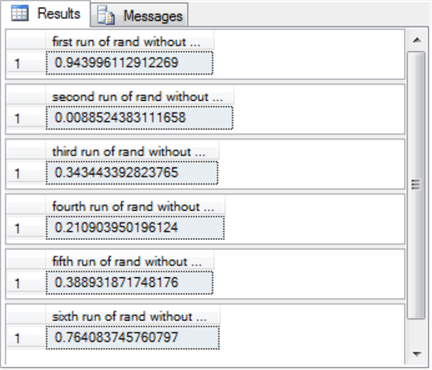
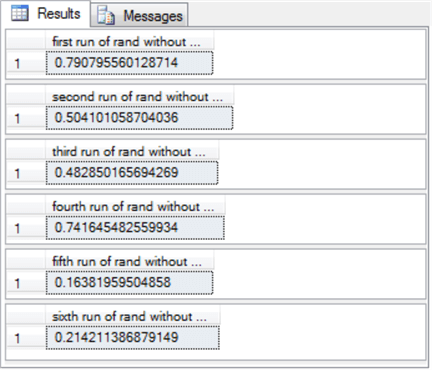
The next script shows six consecutive invocations of the RAND function, but this script does not specify a seed value for the initial function invocation nor any of the other invocations. When you do not specify a seed value, SQL Server automatically assigns a random value in the background. Therefore, each invocation returns a list of six pseudo-random values, but the list does not repeat across successive runs of the script.
-- initial run with no seed value
select rand() [first run of rand without seed]

select rand() [second run of rand without seed]

select rand() [third run of rand without seed]

select rand() [fourth run of rand without seed]

select rand() [fifth run of rand without seed]

select rand() [sixth run of rand without seed]
Here’s the output from two consecutive runs of the preceding script. Notice the results sets are different across consecutive runs. The list of pseudo-random numbers in each list are unique because there is no user-supplied seed value for the initial invocation of the RAND function.
| Results set from first run of preceding script | Results set from second run of preceding script |
|
|
Generating a uniform distribution of random digits
By default, the RAND function returns values with a uniform distribution. By a uniform distribution, it is meant the frequency is the same across discrete pseudo-random values as well as across continuous pseudo-random value ranges with the same width. Furthermore, SQL developers can transform the uniform float values from the RAND function to discrete values, such as the integer values of one through ten. This section demonstrates the code for accomplishing this kind of transformation for RAND function output. In addition, this section examines the pseudo-random digit output from a script to confirm that the counts for the ten digits is approximately the same across successive script runs.
Here’s the script to create a fresh version of a table for storing randomly created digits, populating the table with one thousand digits, and then counting the frequency of occurrence of each digit value in the set.
- The script starts with a block of code to drop any prior version of the
#rand_digits table. This is the table that stores the one thousand digits
created by a transformation of the output from the RAND function.
- A try block followed by a catch block conditionally drops the #rand_digits table. If the table does not exist already, a message is printed in the SQL Server Management Studio Messages tab indicating the table is not available to drop.
- Next, a create table statement creates a fresh copy of rand_digits. The table has one column named rand_digit with a tinyint data type.
- The next code block declares and populates some local variables to manage
the operation of the rest of the script block.
- The @min_integer and @max_integer local variables specify the minimum and maximum integer value to be randomly generated. The script in this demonstration transforms the float values returned by the RAND function into integers in the range of one through ten.
- The @loop_ctr and @max_loop_ctr local variables facilitate the control
of how many passes to perform through a while loop. Each pass through
the loop generates and stores a successive random number.
- The @loop_ctr variable starts with a value of zero.
- On each successive pass through a while loop, the value of @loop_ctr is incremented by one.
- When @loop_ctr equals the value of @max_loop_ctr, the script transfers control to the first statement after the loop.
- The next block of code transforms float values returned by the RAND function
to digits from one through ten. In addition, on each pass through the
loop, the randomly created digit based on the output of the RAND function is
inserted into the #rand_digits table.
- Begin and end statements delimit the code to be executed on each pass through the while loop.
- The select statement following an insert statement in the while loop transforms the float values generated by the RAND function to integers from one through ten. By re-specifying the values for @min_integer and @max_integer as well as perhaps their data type, you can designate any other minimum and maximum values your requirements dictate.
- After a random digit is inserted into #rand_digits, a set statement increments the value of @loop_ctr by one.
- The final block of code in the script counts each digit created by the one
thousand passes through the while loop.
- A select statement groups the rows by rand_digit values.
- The column of count function values is assigned the alias frequency.
- An order by clause arranges the output from the select statement in ascending order by rand_digit value.
-- This code sample returns a uniform distribution of
-- digits from @min_integer (1) through @max_integer (10)

-- create a fresh copy of #rand_digits
begin try
drop table #rand_digits
end try
begin catch
   print '#rand_digits not available to drop'
end catch

create table #rand_digits
(
rand_digit tinyint
)

-- declare min and max random digit values
-- and variables values to control loop count
declare
 @min_integer tinyint =   1
,@max_integer tinyint =  10
,@loop_ctr int = 0
,@max_loop_ctr int = 1000

-- loop 1000 times
while @loop_ctr < @max_loop_ctr
begin

-- generate a random digit from @min_integer through @max_integer
-- and insert it into #rand_digits
insert #rand_digits(rand_digit)
select floor(rand()*(@max_integer - @min_integer + 1) + @min_integer)

set @loop_ctr = @loop_ctr + 1

end

-- count the number of each randomly computed digit
-- and display the results
select rand_digit, count(*) [frequency]
from #rand_digits
group by rand_digit
order by rand_digit
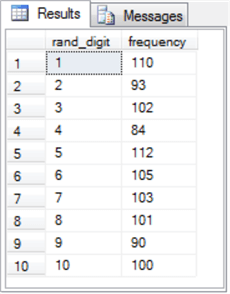
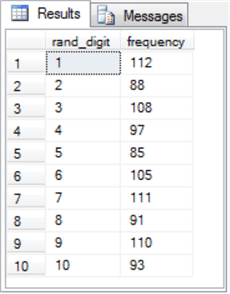
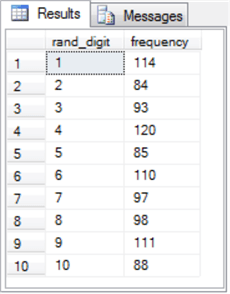
The following table shows the results sets from three consecutive runs of the preceding script.
- Notice that each results set has rand_digit and frequency columns.
- The rand_digit column values extend from one through ten in each results set.
- The frequency column values vary from one results set to the next. However, you can see that the frequency column values are around 100 for each row. This outcome indicates the frequency values are approximately uniformly distributed within each of the three results sets.
- The frequency column values are distinct because the pseudo-rand values generated from each run of the script is unique even while their distribution overall reflects a uniform distribution.
Pseudo-random digit values that are uniformly distributed offer many potential benefits to database applications, including taking a random sample of the rows in a very large table. The next section illustrates one approach to implementing this kind of solution.
| Results set from 1st Script Run | Results set from 2nd Script Run | Results set from 3rd Script Run |
|
|
|
Selecting a random sample from a very large table
Two prior tips demonstrated how to create a data warehouse of historical stock prices and volumes with data from the first trading date in 2009 through October 7, 2019. The Next Steps section in this tip contains links for learning more about the data warehouse. A fact table in the data warehouse (yahoo_prices_valid_vols_only) contains over fourteen million rows. Before demonstrating random sampling techniques for rows from a large table, it will be helpful to query the yahoo_prices_valid_vols_only table to gather a few metrics on its contents. The following script generates these metrics.
Not only does the following script compute the metrics, but it also creates a temporary table (#symbols_with_all_dates) with a subset of the stock symbols from the data warehouse. The temporary table stores a subset of symbols from the data warehouse with a distinct symbol_id integer value for each symbol.
- The script starts by creating a fresh copy of the table (#symbols_with_all_dates).
- Next, the script reveals the exact number of rows in the fact table (14,620,885).
- Then, the script shows the total number of symbols in the fact table (8,089).
- This is followed by another select statement that counts the number of distinct trading dates in the fact table (2709).
- Stock markets regularly register new stocks for trading as well as drop existing stocks that are no longer traded. The next query finds a subset of symbols that has a date value for all the distinct trading dates in the data warehouse. The row_number function in a query assigns a symbol_id value to each such symbol. There are 2,614 symbols in the subset. This subset populates the #symbols_with_all_dates table.
- The final select statement in the script displays the rows in #symbols_with_all_dates.
begin try
   drop table #symbols_with_all_dates
end try
begin catch
   print '#symbols_with_all_dates not available to drop'
end catch
go

-- number of rows (14,620,885) in the yahoo_prices_valid_vols_only table
select count(*) [number of rows]
from for_csv_from_python.[dbo].[yahoo_prices_valid_vols_only]

-- 8089 symbols
select count(distinct symbol) distinct_symbol_count
from for_csv_from_python.[dbo].[yahoo_prices_valid_vols_only]

-- 2709 trading dates
select count(distinct [date]) distinct_date_count
from for_csv_from_python.[dbo].[yahoo_prices_valid_vols_only]

-- 2614 symbols have all trading dates (2709)
select row_number() over (order by symbol) symbol_id, symbol
into #symbols_with_all_dates
from for_csv_from_python.[dbo].[yahoo_prices_valid_vols_only]
group by symbol
having count([close]) =
(
-- 2709 trading dates
select count(distinct [date]) distinct_date_count
from for_csv_from_python.[dbo].[yahoo_prices_valid_vols_only]
)

-- display contents of #symbols_with_all_dates
select * from #symbols_with_all_dates order by symbol
Starting with #symbols_with_all_dates and yahoo_prices_valid_vols_only, the next script demonstrates how to draw two different random samples each having ten symbols from the distinct symbols in #symbols_with_all_dates. There are 7,081,326 rows in the target population from which sampling is performed. These rows are derived for price and volume data for each of 2614 symbols for 2709 trading dates.
There are two major code blocks in the script below. The first code block is for drawing a random sample for the first set of ten symbols. The second code block is for drawing a sample for the second set of ten symbols. Each block of code commences with a pair of header comment lines denoting the code as for the first or second sample.
- The script begins by creating a fresh copy and populating the #sample_1_of_symbols table. The second code block creates a fresh copy and populates the #sample_2_of_symbols table. Both major code blocks conclude by displaying data for first and last trading date for each symbol in its sample.
- The code block for each sample uses a different seed value for the initial
RAND function invocation that specifies its symbols.
- The seed value for the first sample is 1.
- The seed value for the second sample is 2.
- The pseudo-random digits for each sample are in the range from 1 through 2,614. Each digit corresponds to a distinct symbol. The symbols are stored in #sample_1_of_symbols for the first sample and #sample_2_of_symbols for the second sample.
- The final two select statements in each major code block displays the prices
and volumes for each sample of symbols. These select statements draw on yahoo_prices_valid_vols_only
and either #sample_1_of_symbols or #sample_2_of_symbols.
- The first select statement displays data for the first trading date.
- The second select statement displays data for the last trading date.
-- random list based on initial seed value 1 for 10 symbol values
-- selected from #sample_1_of_symbols

begin try
drop table #sample_1_of_symbols
end try
begin catch
   print '#sample_1_of_symbols not available to drop'
end catch

declare
 @min_integer int =   1
,@max_integer int =  2614

select symbol
into #sample_1_of_symbols
from #symbols_with_all_dates

inner join

(-- repeatable list of 10 symbol_id values joined to
select floor(rand(1)*(@max_integer - @min_integer + 1) + @min_integer) symbol_id
union all
select floor(rand()*(@max_integer - @min_integer + 1) + @min_integer)
union all
select floor(rand()*(@max_integer - @min_integer + 1) + @min_integer)
union all
select floor(rand()*(@max_integer - @min_integer + 1) + @min_integer)
union all
select floor(rand()*(@max_integer - @min_integer + 1) + @min_integer)
union all
select floor(rand()*(@max_integer - @min_integer + 1) + @min_integer)
union all
select floor(rand()*(@max_integer - @min_integer + 1) + @min_integer)
union all
select floor(rand()*(@max_integer - @min_integer + 1) + @min_integer)
union all
select floor(rand()*(@max_integer - @min_integer + 1) + @min_integer)
union all
select floor(rand()*(@max_integer - @min_integer + 1) + @min_integer)
) repeatable_symbol_list

on #symbols_with_all_dates.symbol_id = repeatable_symbol_list.symbol_id

-- display date, symbol as well as open, high, low, close prices
-- along with volumes for top and bottom ten symbols/dates from join of
-- yahoo_prices_valid_vols_only and #sample_1_of_symbols tables
select top 10  [yahoo_prices_valid_vols_only].*
from for_csv_from_python.[dbo].[yahoo_prices_valid_vols_only]
inner join #sample_1_of_symbols on [yahoo_prices_valid_vols_only].Symbol = #sample_1_of_symbols.symbol
order by date asc, symbol asc

select top 10  [yahoo_prices_valid_vols_only].*
from for_csv_from_python.[dbo].[yahoo_prices_valid_vols_only]
inner join #sample_1_of_symbols on [yahoo_prices_valid_vols_only].Symbol = #sample_1_of_symbols.symbol
order by date desc, symbol asc

-- random list based on initial seed value 2 for 10 symbol values
-- selected from #sample_2_of_symbols

begin try
drop table #sample_2_of_symbols
end try
begin catch
   print '#sample_2_of_symbols not available to drop'
end catch

--set @min_integer =   1
--set @max_integer =  2614

select symbol
into #sample_2_of_symbols
from #symbols_with_all_dates

inner join

(-- repeatable list of 10 symbol_id values joined to
select floor(rand(2)*(@max_integer - @min_integer + 1) + @min_integer) symbol_id
union all
select floor(rand()*(@max_integer - @min_integer + 1) + @min_integer)
union all
select floor(rand()*(@max_integer - @min_integer + 1) + @min_integer)
union all
select floor(rand()*(@max_integer - @min_integer + 1) + @min_integer)
union all
select floor(rand()*(@max_integer - @min_integer + 1) + @min_integer)
union all
select floor(rand()*(@max_integer - @min_integer + 1) + @min_integer)
union all
select floor(rand()*(@max_integer - @min_integer + 1) + @min_integer)
union all
select floor(rand()*(@max_integer - @min_integer + 1) + @min_integer)
union all
select floor(rand()*(@max_integer - @min_integer + 1) + @min_integer)
union all
select floor(rand()*(@max_integer - @min_integer + 1) + @min_integer)
) repeatable_symbol_list

on #symbols_with_all_dates.symbol_id = repeatable_symbol_list.symbol_id

-- display date, symbol as well as open, high, low, close prices
-- along with volumes for top and bottom ten symbols/dates from join of
-- yahoo_prices_valid_vols_only and #sample_2_of_symbols tables
select top 10  [yahoo_prices_valid_vols_only].*
from for_csv_from_python.[dbo].[yahoo_prices_valid_vols_only]
inner join #sample_2_of_symbols on [yahoo_prices_valid_vols_only].Symbol = #sample_2_of_symbols.symbol
order by date asc, symbol asc

select top 10  [yahoo_prices_valid_vols_only].*
from for_csv_from_python.[dbo].[yahoo_prices_valid_vols_only]
inner join #sample_2_of_symbols on [yahoo_prices_valid_vols_only].Symbol = #sample_2_of_symbols.symbol
order by date desc, symbol asc
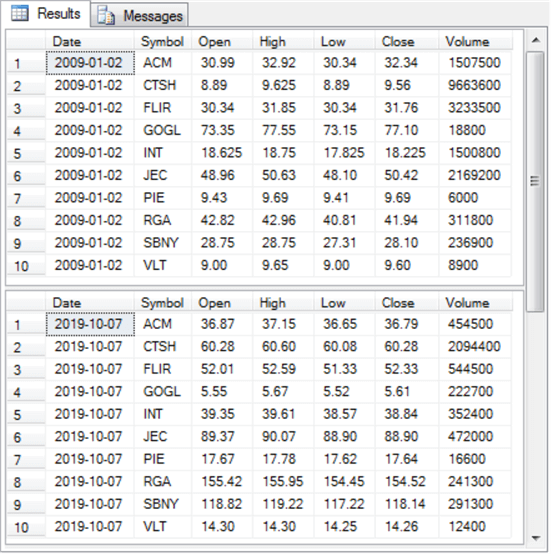
The preceding script displays four results sets – two for the first sample and two more for the second sample. The structure of the pair of results sets for each sample is the same. Therefore, the following screen shot shows just the two results sets for the first sample. Additionally, all four results sets are displayed later in an Excel worksheet and discussed from an analytical perspective.
The next two screen shots display results sets for the first sample from SQL Server Management Studio.
- Each results set has three types of data.
- The first type includes two columns, Date and Symbol, that identify each row by a trading date and a symbol.
- The second type of data includes four types of prices.
- The close price is critical in that it reveals the price for a stock at the end of a trading date.
- The other three prices convey some feel for the path of a stock’s
price during a trading date on its way to the close price.
- The open price shows the price at the open of a trading date.
- The high and the low prices indicate, respectively, the top and the bottom prices on a trading date.
- The third type of data is in the Volume column. This indicates the number of shares exchanged during a trading date. Generally, analysts ascribe more significance to prices during a trading date when the volume is significantly above average.
- The first results set for the first sample appears on top. This results set shows the three types of data for the first trading date for each of the symbols belonging to the first sample.
- The second results set for the first sample appears on the bottom in the screen shot below. This results set displays the three types of data for the last trading date for each of the symbols belonging to the first sample.
The next screen shot is for an Excel spreadsheet showing a pair of results sets for each sample.
- The first and second results sets for the first sample appear, respectively,
in rows 3 through 12.
- The first results set for the first trading date (1/2/2009) appears in columns A through G.
- The second results set for the last trading date (10/7/2019) appears in columns I through O.
- The first and second results sets for the second sample appears, respectively,
in rows 20 through 29.
- Again, the first results set for the first trading date (1/2/2009) appears in columns A through G.
- Also, the second results set for the last trading date (10/7/2019) appears in columns I through O.
- The symbols for each sample are listed in alphabetical order in column B.
- The first symbol in the first sample is ACM, and the last symbol in the first sample is VLT.
- The first symbol in the second sample is BFIN, and the last symbol in the second sample is PIE.
Several analyses follow to help identify if and how the two different samples confirm they are from the same population of price and volume data because they yield similar results.
- Cell Q14 is the average percent gain between the first and last close price across the ten symbols in the first sample. Therefore, the average close price gain for the first sample is slightly greater than 142 percent. The comparable price gain for the second sample (see cell Q31) is slightly more than 215 percent. Because of the disparity in average close price gain percent values, it is not obvious that both samples are from the same population.
- Columns S, T, and U show a different kind of comparison between the two
samples.
- The values in column S for rows 3 through 12 in the first sample and
rows 20 through 29 in the second sample are
- 1 when the percent gain is greater than five percent per year for the last close price relative to the first close price
- 0 when the last close price is not five percent greater per year than the first close price
- The 0’s and 1’s in column T are assigned as
- 1 when the last close price is more than ten percent greater per year than the first close price
- 0 when the last close price is not more than ten percent greater per year than the first close price
- The cut-off value for being 1 in column U is more than fifteen percent greater per year (and 0 otherwise).
- The values in column S for rows 3 through 12 in the first sample and
rows 20 through 29 in the second sample are
- The results across all the symbols are summarized in row 15 for the first
sample and in row 32 for the second sample. As you can see, the percent
greater than a criterion value is very similar across the two samples.
- Both the five percent per year and ten percent per year comparisons
are exactly the same at
- 60% for more than the five percent per year comparison
- 30% for the more than ten percent per year comparison
- In general, you can see there is a tendency for the percent greater than a criterion value to decline as the criterion value rises. This general trend continues through the fifteen percent per year criterion, but the proportion of sample symbols is not exactly the same between the two samples: ten percent for the first sample and twenty percent for the second sample.
- Both the five percent per year and ten percent per year comparisons
are exactly the same at
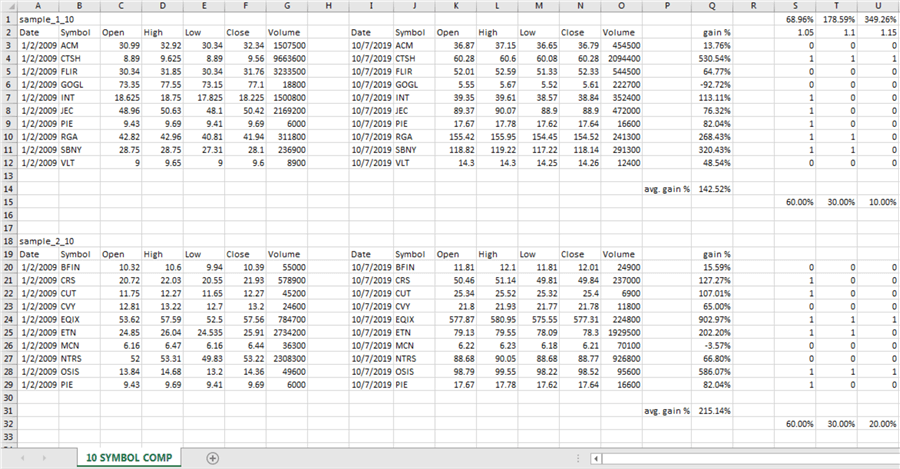
The preceding analyses in this section are just a selection of examples for assessing if and how two samples from the same underlying population yield comparable results. As this section confirms, the assessment about if two samples are similar depends on how you compare them. Therefore, you should tailor your comparisons based on the needs of those requiring the results.
Next Steps
The T-SQL scripts and worksheets for data displays and analyses are available in this tip’s download file. After you confirm that you are getting valid results with the code from the download file, try variations to T-SQL code from this tip.
- You can re-run the second script in the first section with different seed values to confirm that pseudo-random sequences depend on the seed value for the RAND function.
- You can also change the assignments for the @min_integer and @max_integer local variables for the script for the “Generating a uniform distribution of random digits” section. These changes will allow you to confirm your ability to control the minimum and maximum pseudo-random values generated by a RAND function.
If you want to test the code for this tip’s last section, then you also need to run scripts from Collecting Time Series Data for Stock Market with SQL Server and Time Series Data Fact and Dimension Tables for SQL Server. Scripts from these two prior tips will re-create the yahoo_prices_valid_vols_only table in your SQL Server instance. You can draw different samples of symbols from those in the last section by specifying different seed values for the initial RAND function invocations.
Of course, the best way to derive value from this tip is by running the code in the download for this tip with your company’s data. If you encounter issues, I look forward to answering any questions that you have about how the code should work and/or how to get the code to work for your personal needs.


About the author
 Rick Dobson is an author and an individual trader. He is also a SQL Server professional with decades of T-SQL experience that includes authoring books, running a national seminar practice, working for businesses on finance and healthcare development projects, and serving as a regular contributor to MSSQLTips.com. He has been growing his Python skills for more than the past half decade -- especially for data visualization and ETL tasks with JSON and CSV files. His most recent professional passions include financial time series data and analyses, AI models, and statistics. He believes the proper application of these skills can help traders and investors to make more profitable decisions.
This author pledges the content of this article is based on professional experience and not AI generated.
View all my tips
