By: Kenneth A. Omorodion | Comments | Related: > Azure
Problem
Azure Log Analytics is a service that is configured to collect telemetry and other data from different sources while also providing an analytics engine and a query language which helps in the monitoring of performance and operations of applications and resources in Azure. See here for more information about Azure Log Analytics.
There has been a huge amount of documentation already done on Azure Monitor in general, however, this tip will only focus on how to set up the Log Analytics in Azure to be later used in the monitoring, analysis and visualization of performance data of an Azure Resource.
Solution
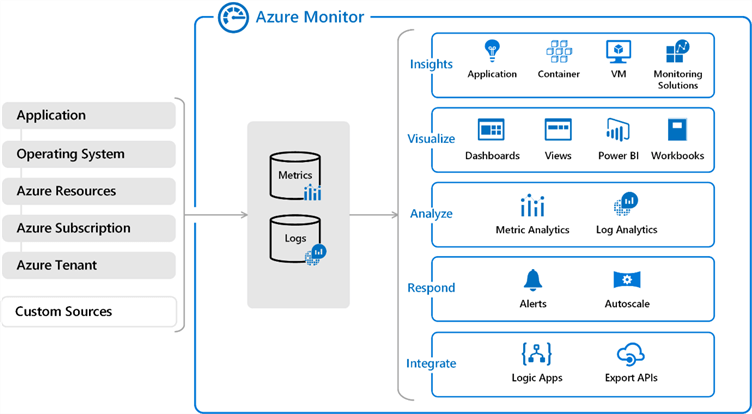
The diagram below is a high-level view of Azure Monitor. Showing at the centee is the two fundamental types of data, including Logs, that can be used in Azure Monitor. At the left-hand side is the various sources of monitoring data that populate each data store and at the extreme right is the various functions performed by Azure Monitor with the collected data. This tip is mainly focusing on Logs as type of data and generating insights from Azure resource using Log Analytics. Source of diagram below here.
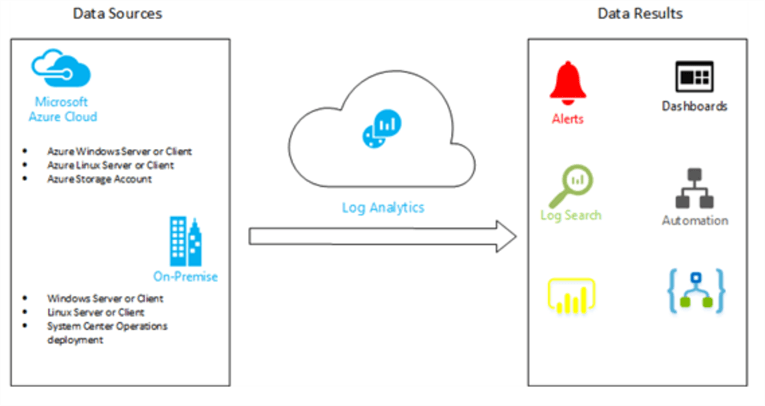
A low-level diagram of the Azure Log Analytics is as shown below.
As mentioned above, there are a lot of metrics that can be generated from the Log Analytics data, but to ensure these are available we need first do the following chronologically as suggested in this approach.
- Create a Log Analytics Workspace
- Enable Logs for a resource
Step 1: Create a Log Analytics Workspace
The Log Analytics Workspace is described as a container that includes data as well as configuration information. You can get more information on Log Analytics Workspaces here.
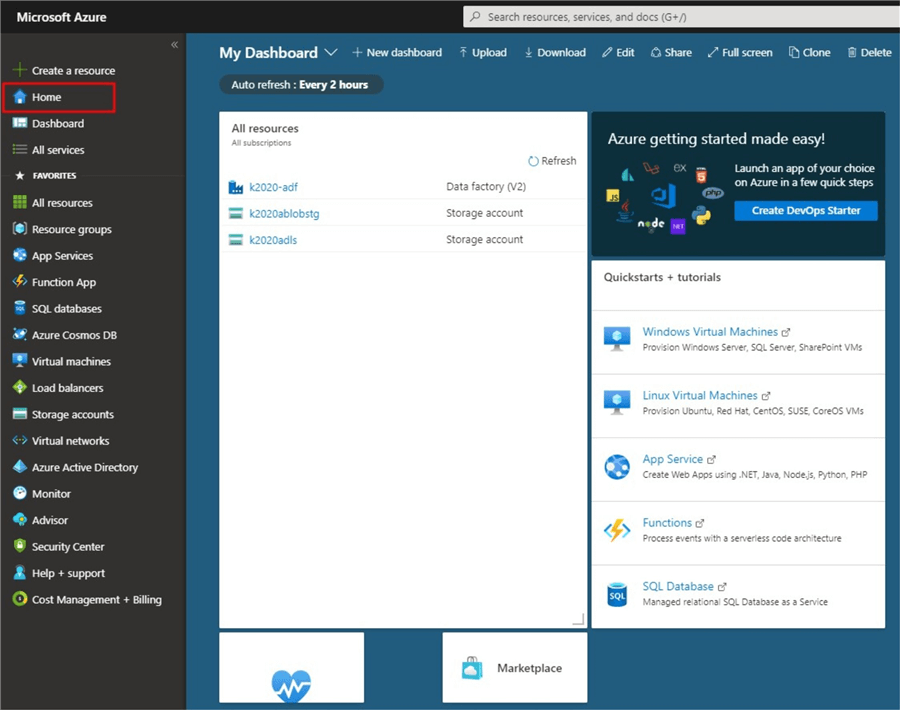
Login to https://portal.azure.com/ and on the left-hand side click on "Home" as seen in the diagram below.
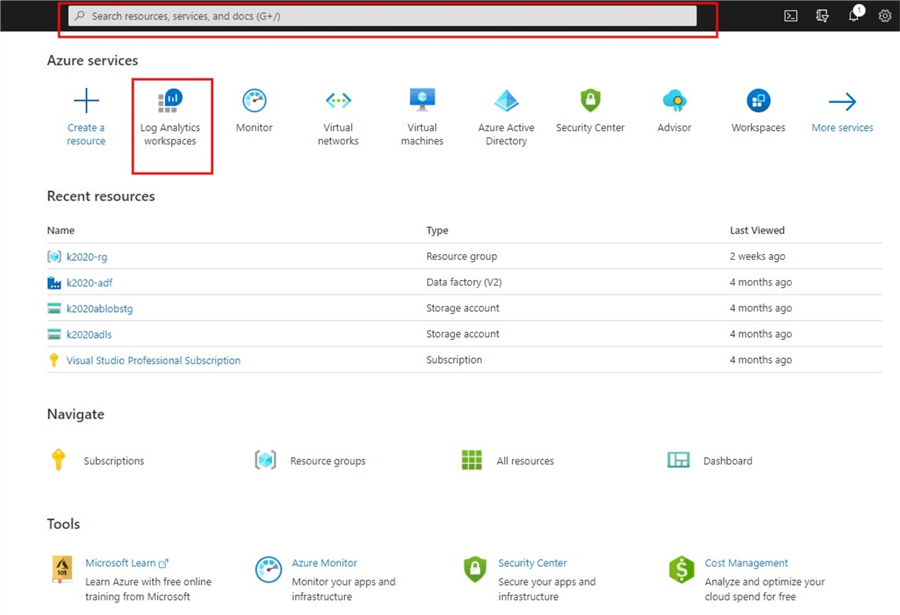
Then search for "Log Analytics Workspace" or select it if it is already among the Azure services highlighted as shown in the diagram below.
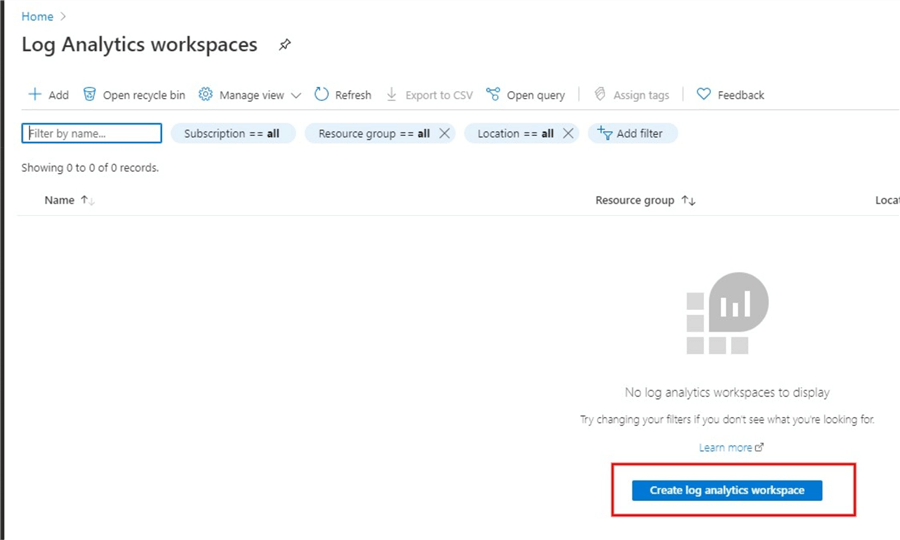
Next, click on "Create Log Analytics Workspace" as seen in the diagram below.
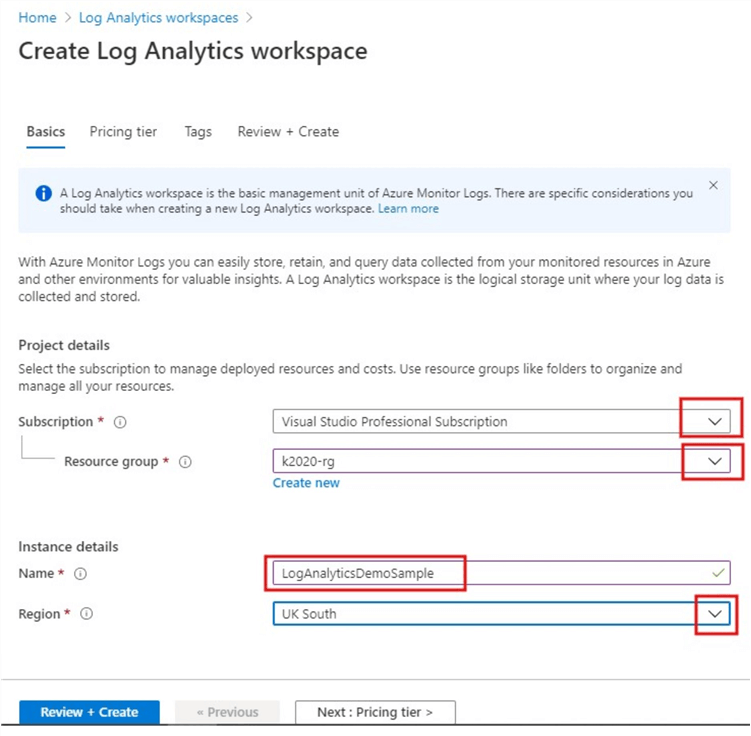
You will be requested to enter an Azure Subscription, Resource Group and Instance details in the next window that opens. In this demo I am using my Visual Studio Professional Subscription for Azure as my Subscription. If you have not already created one, you would need to create a Resource group, see here how to do that. I already have one created as seen in the diagram below. Also, you need to enter a unique Workspace Name (should have 4 to 63 letters, digits or "-") and choose an Azure region as appropriate for you (I have choose UK South as I live in London).
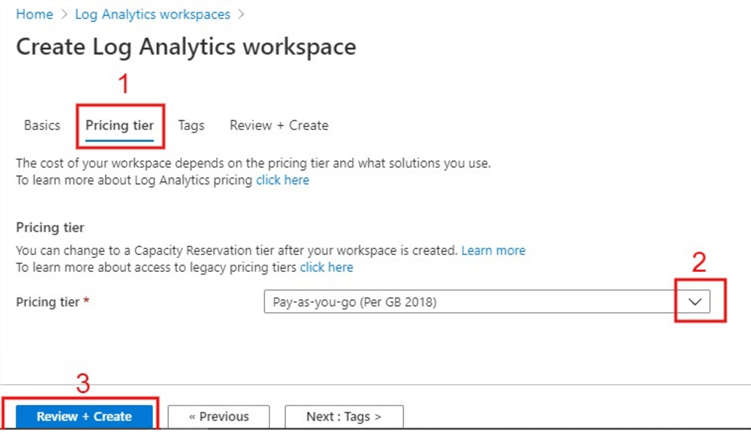
Next click on the "Pricing tier" tab at the top of the page to select your price plan. I have used "Pay-as-you-go" in this demo as seen in the diagram below, you can select some other Pricing tiers as appropriate. See more information on Log Analytics pricing here.
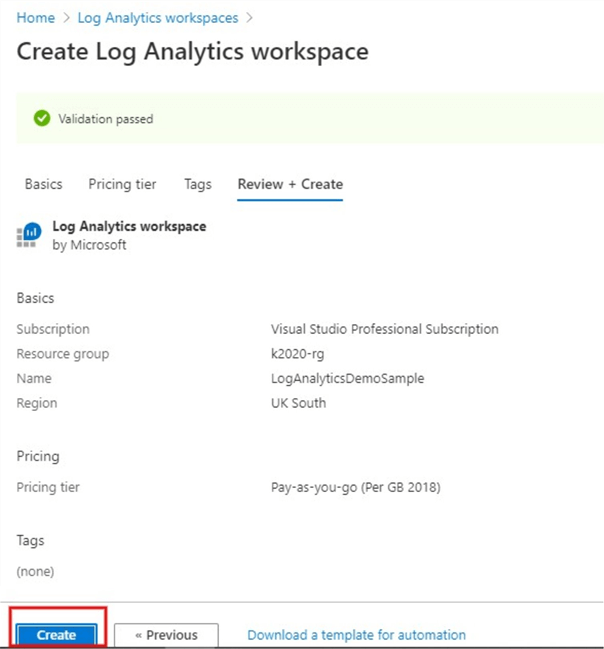
That should do for now. Just click on the "Review + Create" either on the tab or the blue button at the bottom as illustrated in the diagram above. This should show whether your validation has passed or not as seen in the diagram below. Then click "Create" to deploy your Workspace.
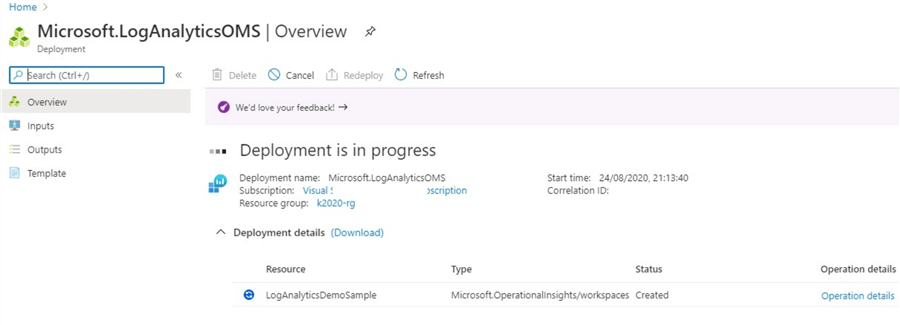
You should now be able to see the deployment process as seen in the diagram below if done correctly.
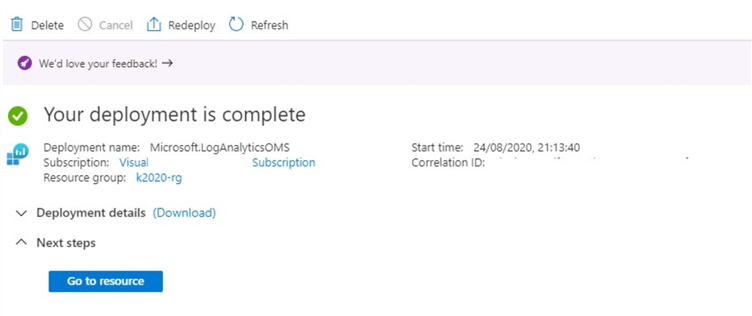
If done correctly, the deployment should be completed with success and the workspace created as shown in the diagram below. This completes the first step.
Step 2: Enable Logs for a resource
There are several resources that can leverage the workspace created to collect Logs data including Virtual Machines.
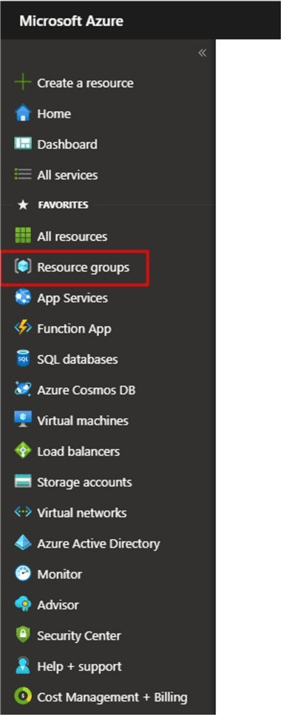
To enable Logs, you can follow the approach in this demo (although you can always achieve same thing via other methods). First, click on "Resource groups" as shown in the diagram below.
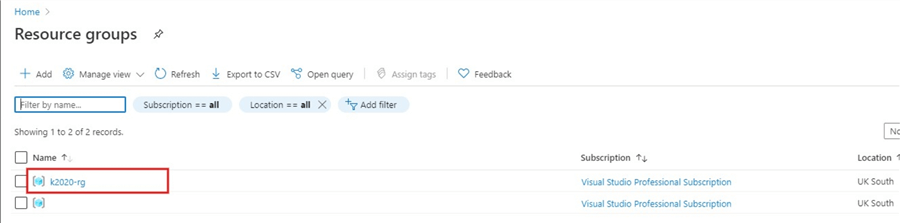
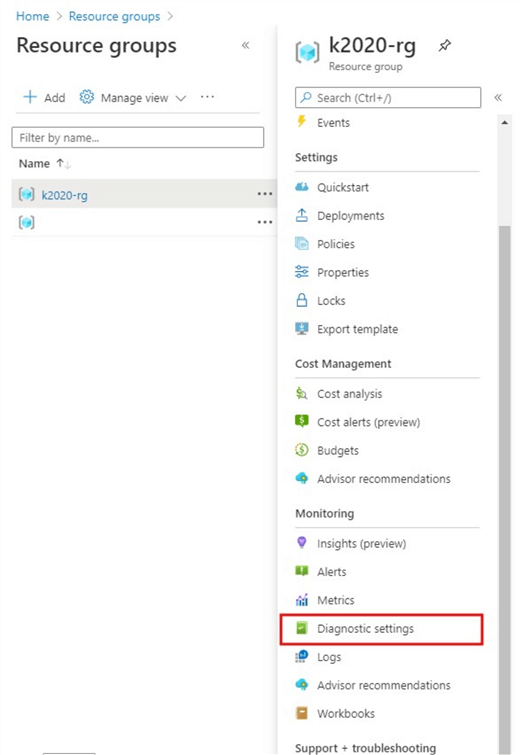
Then click on the name of your Resource group as shown in the diagram below.
Then, among the blades on the left side, select "Diagnostic settings" as seen in the diagram below.
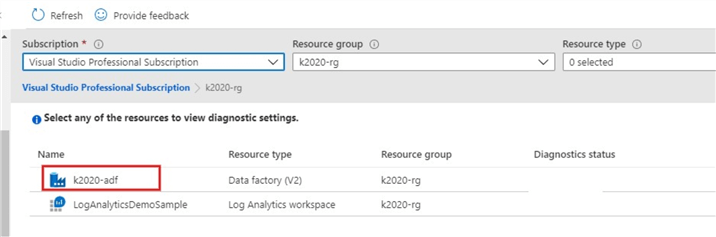
On the next window as seen below, ensure to click on the name of a resource already setup, in my case I have an Azure Data Factory already setup, thus I clicked on the "k2020-adf" which will then take you to the next window where you can configure the diagnostic settings.
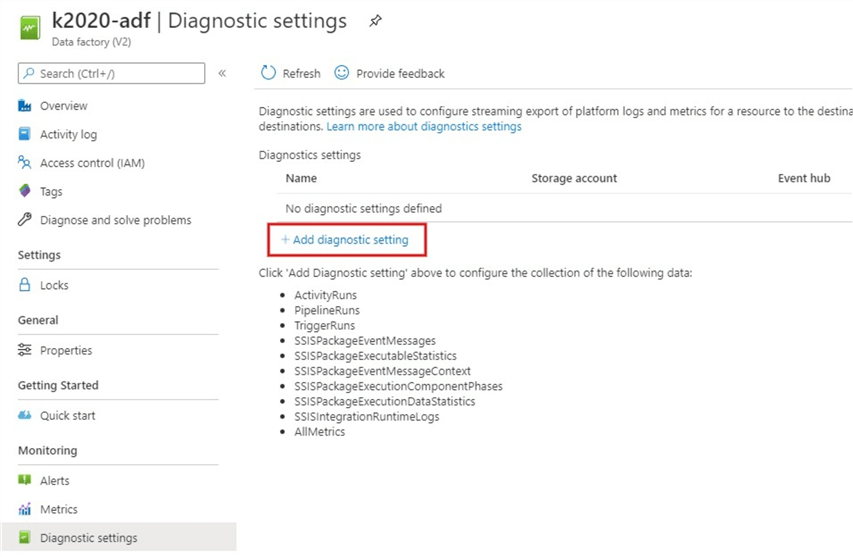
To configure the diagnostic settings, just click on "Add diagnostic setting" as shown in the diagram below.
Next, enter a suitable name for the diagnostic setting, I have entered "LogAnalyticsDemoConfig". For Category detail I have selected the first three logs only under Log for the purpose of this demo (but this can be more, so you might need to select all you need). For destination details I have selected send to Log Analytics only in this demo (again this depends on what you want to enable). Once the "Send to Log Analytics is checked, you would be prompted to select your subscription and Log Analytics workspace. Just enter the Subscription you used when creating the workspace earlier as well as the name of the workspace you created, respectively. See diagram below.
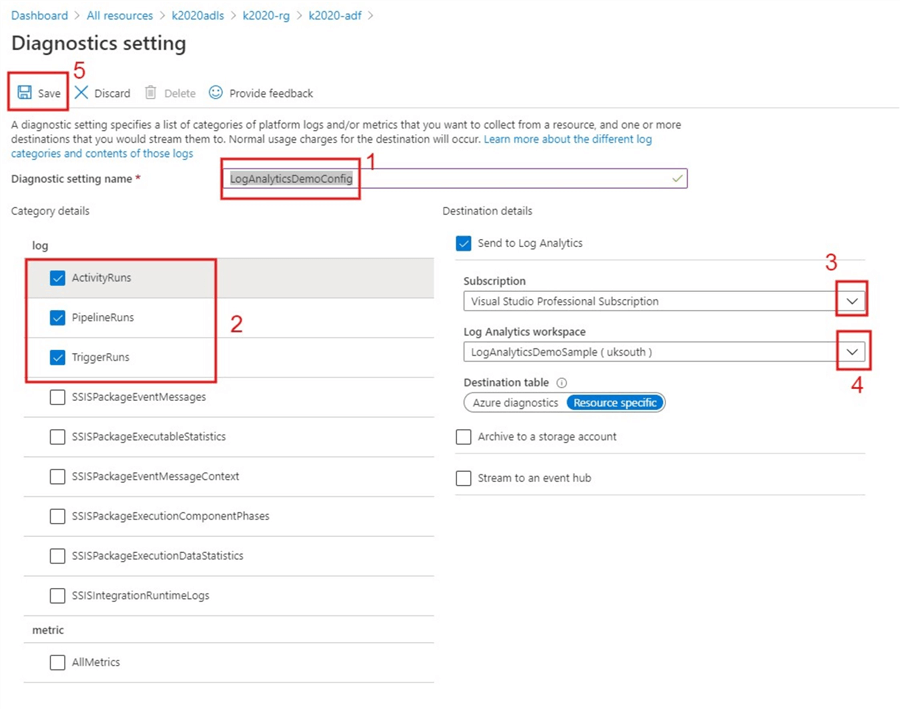
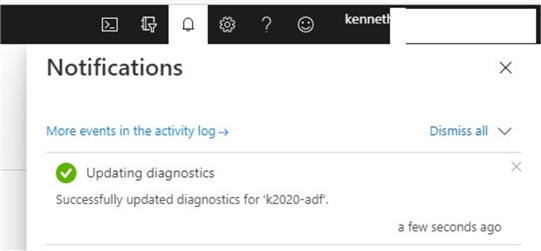
After completing these settings as illustrated, then click Save to save the settings. If the saving is completed successfully, you should see a pop-up message as shown in the diagram below.
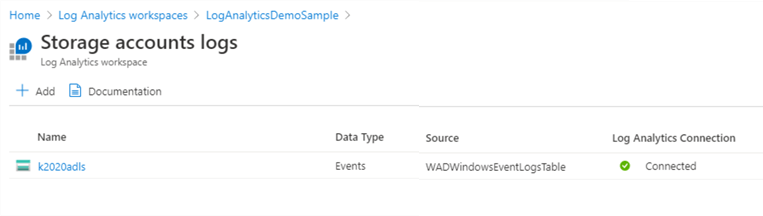
To verify if Log Analytics is connected to the Azure Data Factory, navigate to the Storage accounts logs as seen in the diagram below. You can also use queries now to check performance and other metrics of your Azure Data Factory or any other resource like Virtual machines, Firewalls or Event Hubs etc.
Next Steps
- See more information on Log Analytics workspace here.
- Try this tip out in your own data as business requires.
- Check out the Azure and Azure Data Factory tips on MSSQLTips.com.


About the author
 Kenneth A. Omorodion is a Business Intelligence Developer with over eight years of experience. He holds both a bachelor’s and master’s degree (Middlesex University in London). Kenneth has the MCSA, Microsoft Data Analyst - Power BI and Azure Fundamentals certifications. Kenneth is a Microsoft Certified Trainer and has delivered corporate training on Power BI, SQL Server, Excel and SSRS.
This author pledges the content of this article is based on professional experience and not AI generated.
View all my tips
