By: Kenneth A. Omorodion | Comments (3) | Related: > DevOps
Problem
Azure DevOps Analytics provides the reporting platform for Azure DevOps and Azure DevOps Server. It is enabled for all Azure DevOps services projects and can be used to monitor and measure present or past state of projects by automatically populating itself with data in Azure DevOps. You can read more about Azure DevOps Analytics here.
As of July 2020, not all data in Azure DevOps can be accessed via Analytics, however, at this time it is generally available for Azure DevOps Service and Azure DevOps Server 2020, and can be used to access data for services like Boards, Pipelines and Test Plans. One way to connect Power BI to Azure DevOps data is via Analytics Views (currently in Preview at the time of writing this Tip). Analytics views is described as data sets that are exposed to Power BI in Azure DevOps and can be used to create reports based on your Azure DevOps data. However, there is currently (August 2020) a limitation in that Analytics views only support Azure Boards data (work items) and does not support other Azure DevOps data like Pipelines for now. See more information on this here.
The focus of this tip is how to create DevOps metrics in Power BI using default Analytics views.
Solution
The approach here starts by setting-up prerequisites for Analytics views, then connecting to Power BI Desktop, creating visuals in Power BI Desktop, and Publishing to Power BI service. See the steps as follows.
Step 1: Setting up prerequisites
To begin connecting Azure DevOps data to Power BI via Analytics views, we need to first ensure the following Prerequisites are in place.
- You need to be a member of a project with Basic access or higher.
- You need to ensure Boards is enabled. If it is disabled, Analytics views will not be displayed. See here on how to Turn an Azure DevOps service on or off.
- Since Analytics views is still in Preview at this time, you need to enable the Analytics Views preview feature either for individual users or for the organization.
- Have the *View Analytics permission set to Allow.
If all prerequisites are done correctly you should be ready to connect to Power BI. But before that I will quickly talk about how to enable Analytics views in the preview features. To do this, first log in to your DevOps account on https://dev.azure.com then click on "Overview" as seen in the diagram below to see if Analytics views have been enabled. If enabled you would see it among the list of items, if not then you need to enable it.
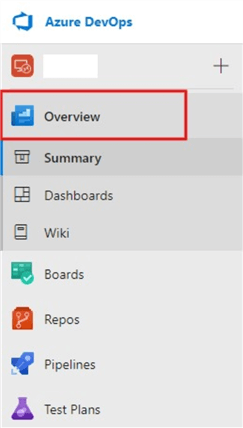
In the diagram above, its obvious Analytics views is yet to be enabled, so the diagram below shows how to enable it within the preview features.
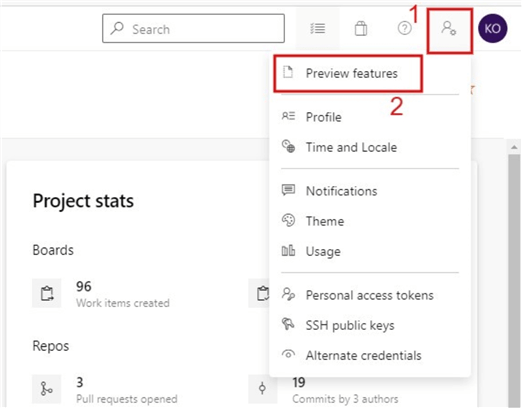
Just click on the preview features and toggle the button for Analytics views to "On" as seen in the diagram below.
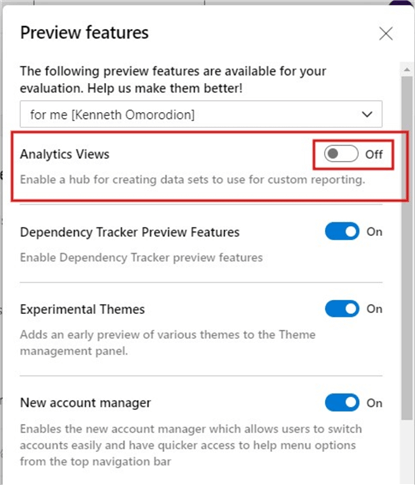
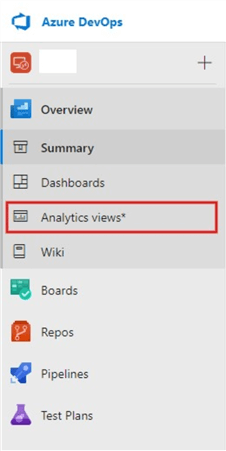
After enabling the feature, you would then be able to see the Analytics views blade as shown in the diagram below. This means Power BI can now connect to it.
Step 2: Connecting to Power BI
Assuming you are still logged in to Azure DevOps, you need to now log in to Power BI Desktop. At the time of writing this blog, there are two connectors in Power BI that can link to Azure DevOps Analytics views they include as follows:
- Azure DevOps (Boards Only)
- Azure DevOps Server (Boards Only)
However, in this tip, I will only leverage the Azure DevOps (Boards Only) connector for demonstration purposes. See more information on this here.
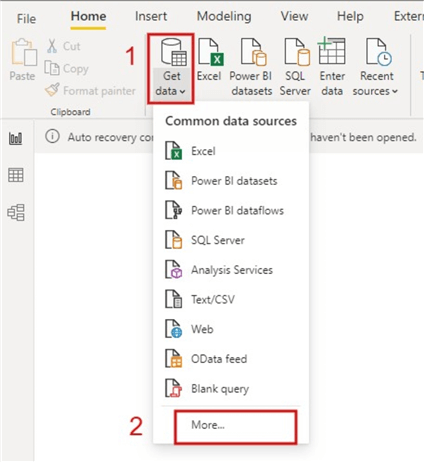
First, click on Get data and select "More" to have access to more Power BI connectors of choice.
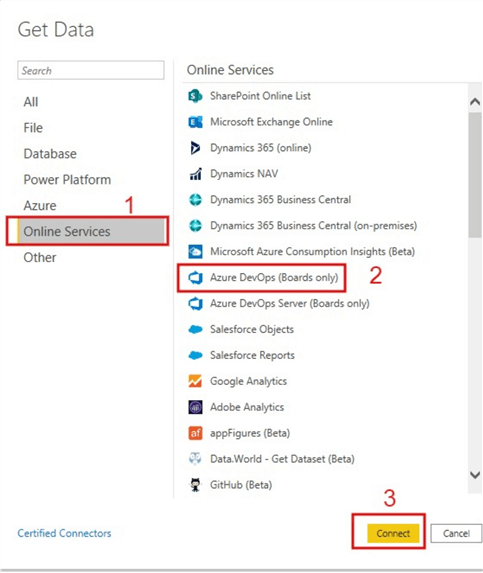
Then, we need to either type a search for the connector we want or just click on "Online Services" to show all in this category. Next, we select "Azure DevOps (Boards Only)" option and click "Connect".
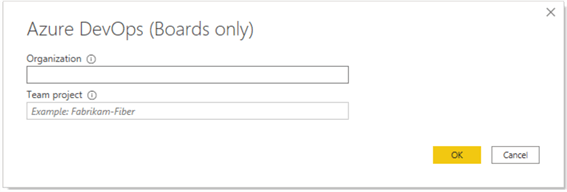
This would lead us to a window where we need to enter the Azure DevOps Team project and Organization details as seen below. To get these details for the sake of those not too conversant with Azure DevOps you need your project URL like the one below.
https://dev.azure.com/{Organisation}/{ProjectName}
Once you get these, enter it into the window in Power BI connector and click "OK".
The next navigator window would list all the pre-built Analytics views existing for the project as shown in the diagram below. One can then choose to select all the views or choose a few of them as required. However, for the purpose of this tip, I have only selected just two of the views as shown in the diagram below.
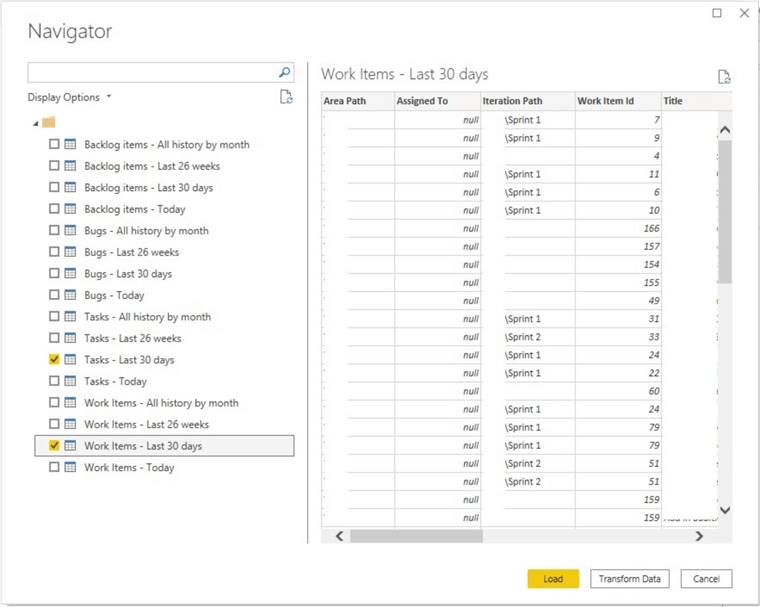
You can choose to "Transform Data" or just "Load", but usually you might want to cleanse the data first before loading the queries.
Step 3: Creating your visuals in Power BI
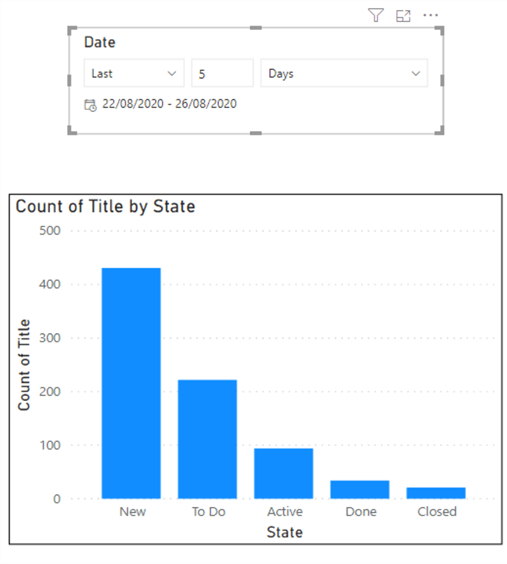
Having loaded the queries successfully, we can now create a basic visual to illustrate the end-product of this tip. As shown in the diagram below, I have created a Card and Column chart visuals to show the number of Work Titles by Work State in the last 5 days. Please feel free to create your own visuals accordingly.
Step 4: Publish to Power BI Service
Next is to save the work and publish to Power BI service. I would like to assume that the reader is conversant with publishing reports to Power Bi service already if not see one of my tips where as part of the demo I illustrated how to do this in detail.
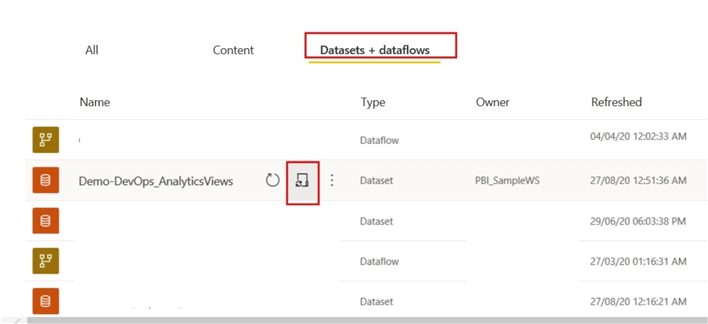
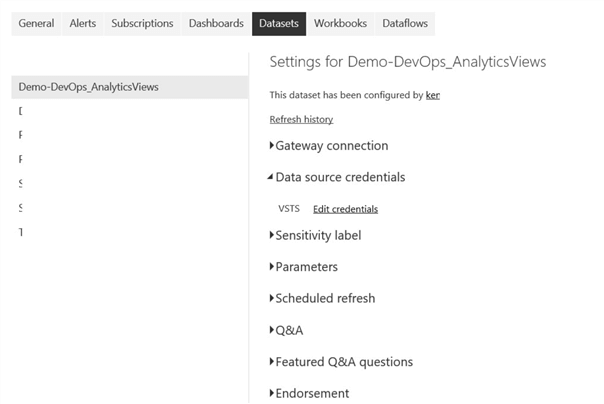
Within Power BI service, you would need to configure a refresh schedule for your dataset to allow it update as scheduled. To do this you need to navigate to the "Datasets + dataflows" settings as shown in diagram below. Then select Schedule refresh.
You might need to configure the data source credentials to ensure refresh can be scheduled. This is illustrated in the diagram below.
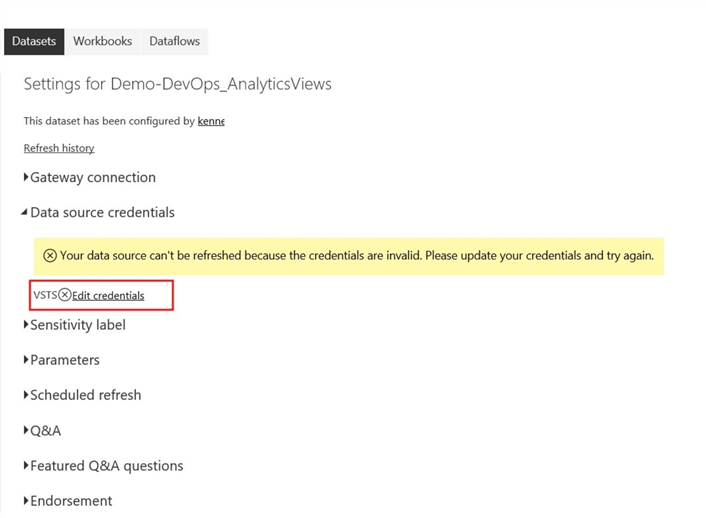
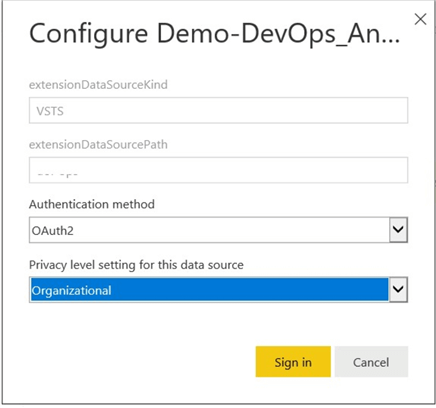
To solve the issue, we need to click on Edit credentials and enter the right authentication. In my case, the Authentication method was "OAuth2" and the Privacy level was "Organizational". After this you would be prompted to enter the account name and password for this authentication, just remember to use the account username and password for you DevOps account as that is the source of the underlying data.
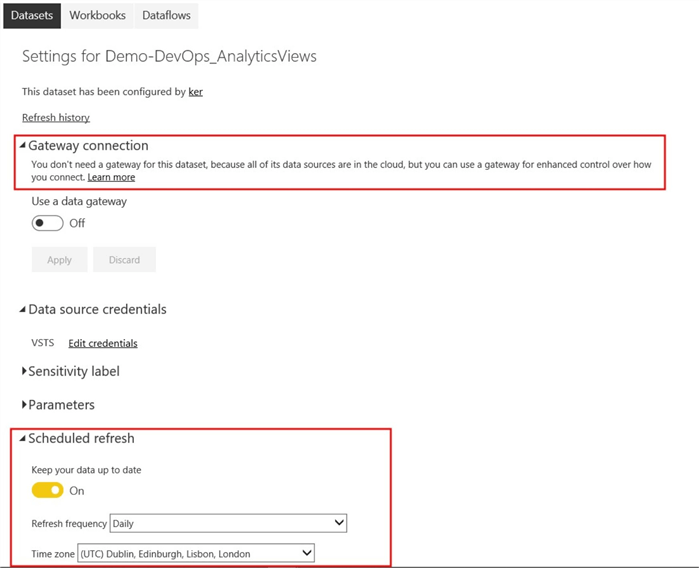
Once the authentication is done right, you would observe that the warning message earlier is now gone as seen in the diagram below.
Also, the diagram below shows that you do not need a gateway usually for this kind of reports as it is a cloud source. Then just schedule your refresh as required, and your report is set.
If you are not too familiar with setting a refresh schedule in Power BI service, I would recommend you read my tip which demonstrates this in detail as part of other tip focus.
Next Steps
- Read more about Azure DevOps Analytics here.
- For more information on prerequisites on Analytics views see here.
- Try this tip out in your own data as business requires.


About the author
 Kenneth A. Omorodion is a Business Intelligence Developer with over eight years of experience. He holds both a bachelor’s and master’s degree (Middlesex University in London). Kenneth has the MCSA, Microsoft Data Analyst - Power BI and Azure Fundamentals certifications. Kenneth is a Microsoft Certified Trainer and has delivered corporate training on Power BI, SQL Server, Excel and SSRS.
This author pledges the content of this article is based on professional experience and not AI generated.
View all my tips
