By: Kenneth A. Omorodion | Updated: 2022-07-19 | Comments | Related: > Power BI
Problem
In June 2022, the dataset details page feature was added to Power BI which can ensure one is able to monitor, explore and leverage datasets within the Power BI service. However, since it's still a relatively new feature at the time of writing this article, most Power BI users are yet to fully understand how this can be of benefit to what they do with Power BI. This article is aimed at providing more guidance as to what you can use it for, how you can start using it, the prerequisites, as well as other information that might be relevant.
Solution
To make this article more interesting and easily understandable by any Power BI user, I will break it into small sections describing most things you need to know relating to Preview Data in Power BI service.
What you can do within this feature depends on the type of Power BI permissions you are assigned. See this Microsoft documentation page for more details about what actions you can and cannot perform. If you have measures on a table sorted within folders in Power BI Desktop, it will not show the folders within the Preview Data page, it will only show the measures as if they were not put in folders.
Opening Preview Data page in Power BI Service
To get to the Preview Data page you can either go through the Data Hub or through a workspace.
To use the Data Hub approach, click on the Data hub.
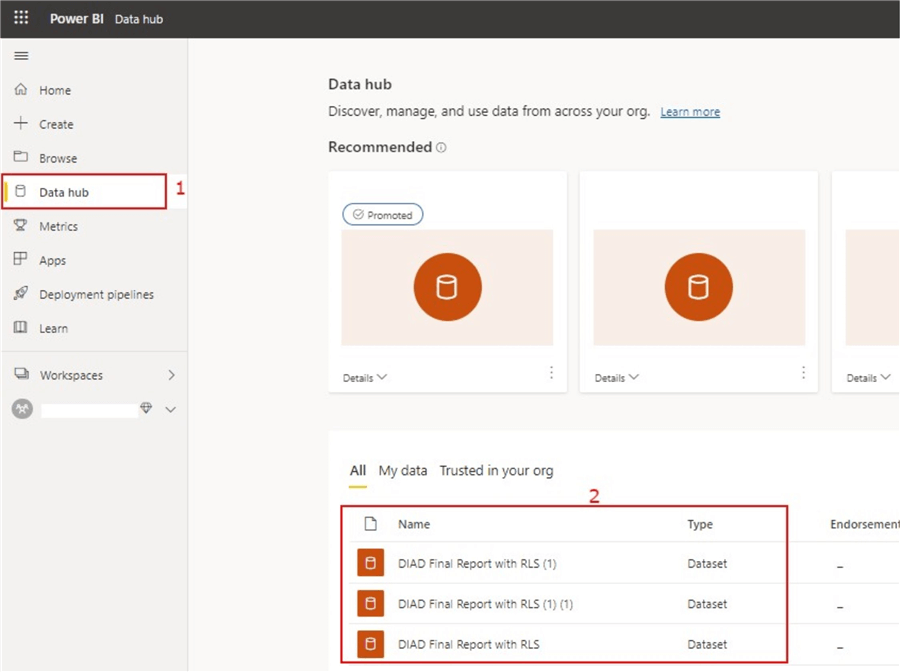
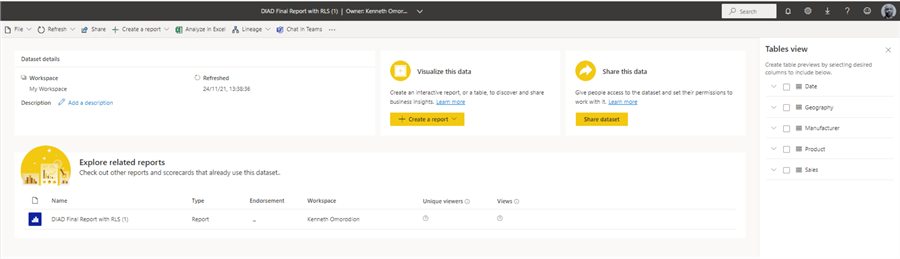
Then click on the dataset you want to use (step 2) and the Preview Data page will open as seen below.
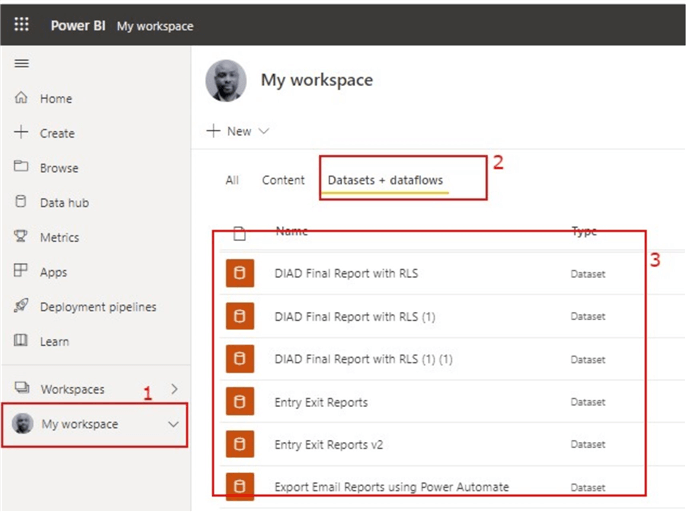
To use the workspace approach, open the workspace where the dataset has been published. Then, while on the "Datasets + dataflows" section, click on the dataset you would like to open the preview data page.
Things you can do with Preview Data page
At the time of writing this article, there are currently several great things you can do on this page as shown below.
Inspect Metadata
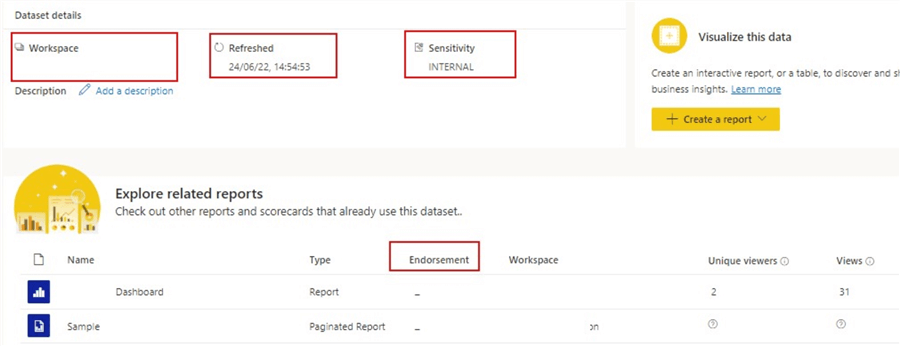
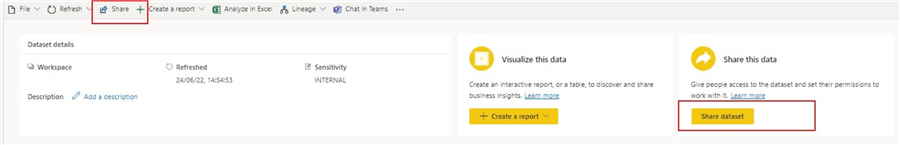
You can inspect the metadata about the selected dataset including the sensitivity, description, and endorsement of the dataset. The image below shows how you can view the sensitivity label, dataset description, endorsement information if any, and any other information about the dataset which can be very useful.
Share the Dataset
Currently, there are two ways of sharing the dataset within the Preview Data page as shown in the image below.
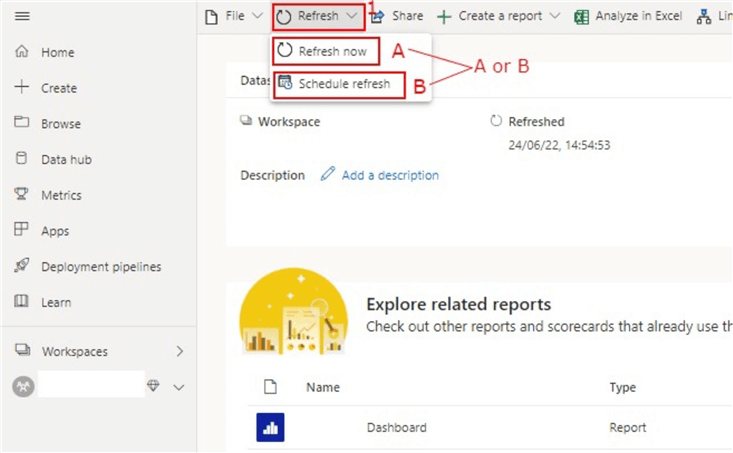
Refresh the Dataset
There are two kinds of refreshes that can be done on the dataset in the Preview Data page: Refresh now and Scheduled refresh. See the image below on how to do these.
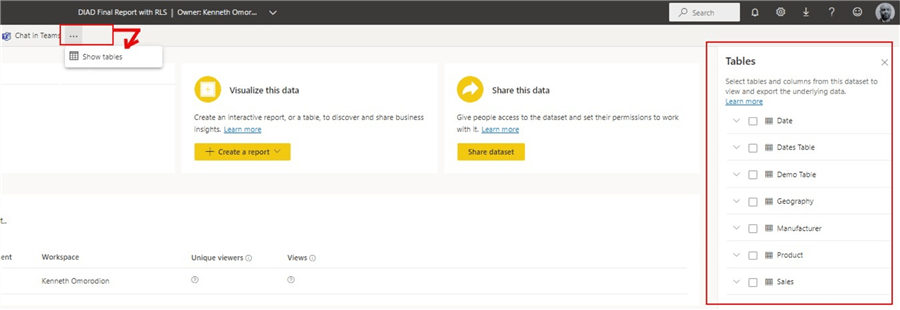
View Tables in the Dataset
The tables contained in the dataset you are previewing should be visible on the right-hand side of the preview data page. If this is not visible for any reason, you can click on the ellipsis at the top of the page to expose the tables as seen below.
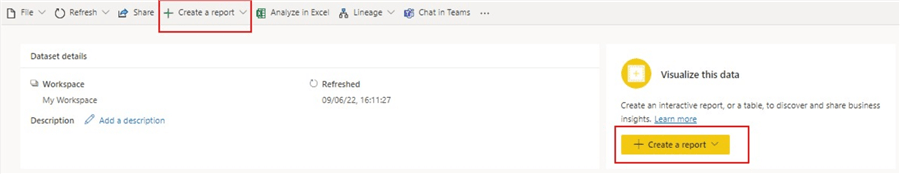
Create New Report from Dataset
You can create a brand-new report from scratch or create a new report as a formatted table leveraging any dataset within the Preview Data page. Like the refresh option, you also have two places where you can create a new report within the preview data page as seen below. Whichever option you chose to use, you can either create a report from scratch or as a formatted table.
If you chose to create from scratch, once you click on the dropdown on "Create a report", a new page should open which looks very similar to the Power BI Desktop UI we are used to as shown below. You can create a brand new report from this dataset using pre-built measures and columns. You can do virtually most things you are able to do on Power BI Desktop apart from some notable things as described in the note below.
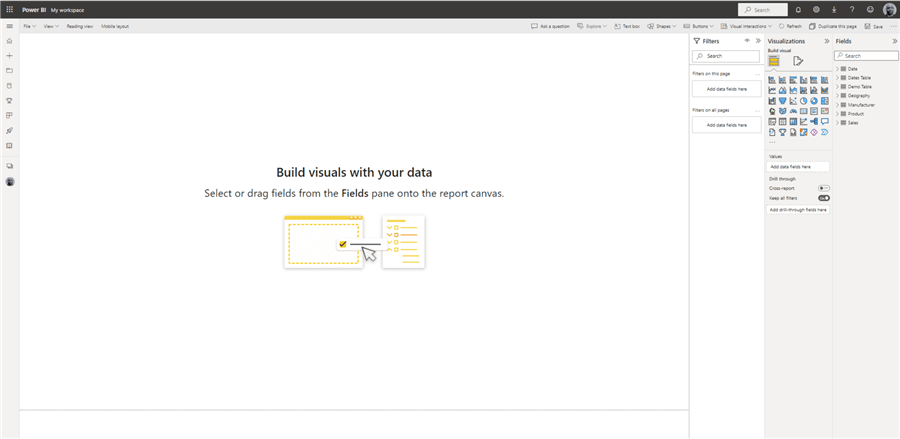
Note: At the time of writing this article you are not able to see the formula bar where you can create or amend a calculated column or measure within the preview data page. You are not able to see the modeling view or the data view. You are not able to use Power Query Editor. And you are not able to create a calculated table.
Also, there are two other ways you can create a report using the preview data page in Power BI service including, Auto-create and Create from Template, but these depend on the type of permissions you have.
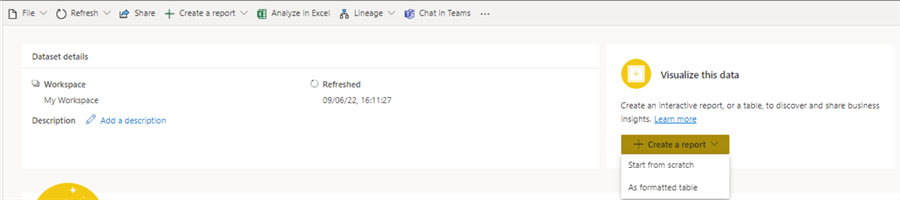
If you chose to create a formatted table, click on the dropdown on "Create a report" " as seen below.
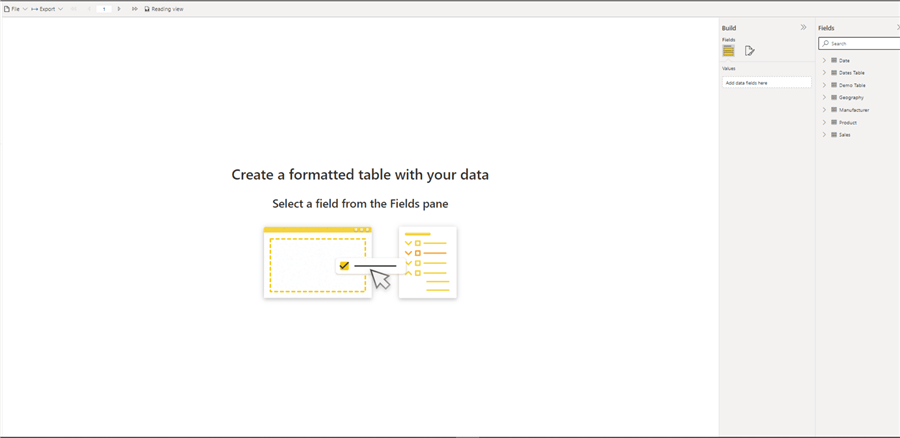
This should then open the page where you can format the dataset as a table depending on the fields selected on the available tables. The screen should look like the image below.
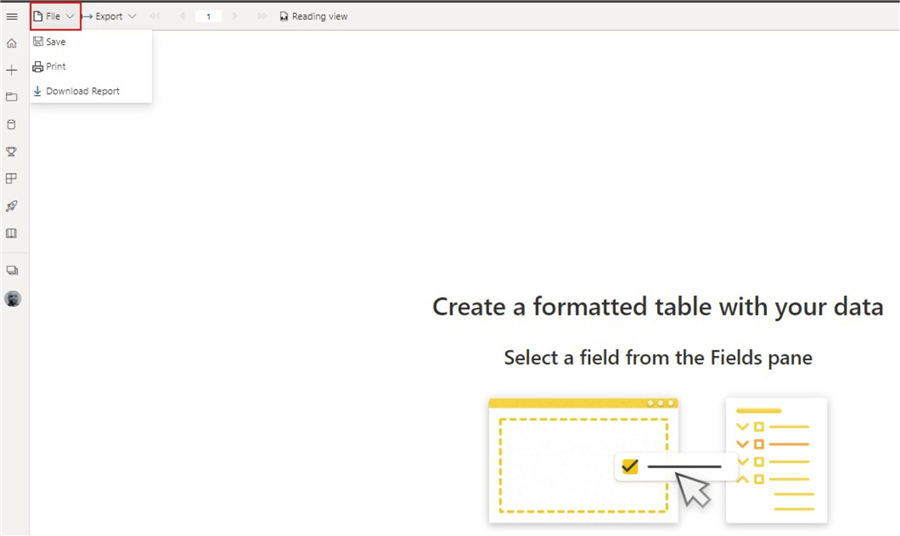
Any formatted tables created can be saved, printed, or you can even download the formatted table using the points on the screen as seen below.
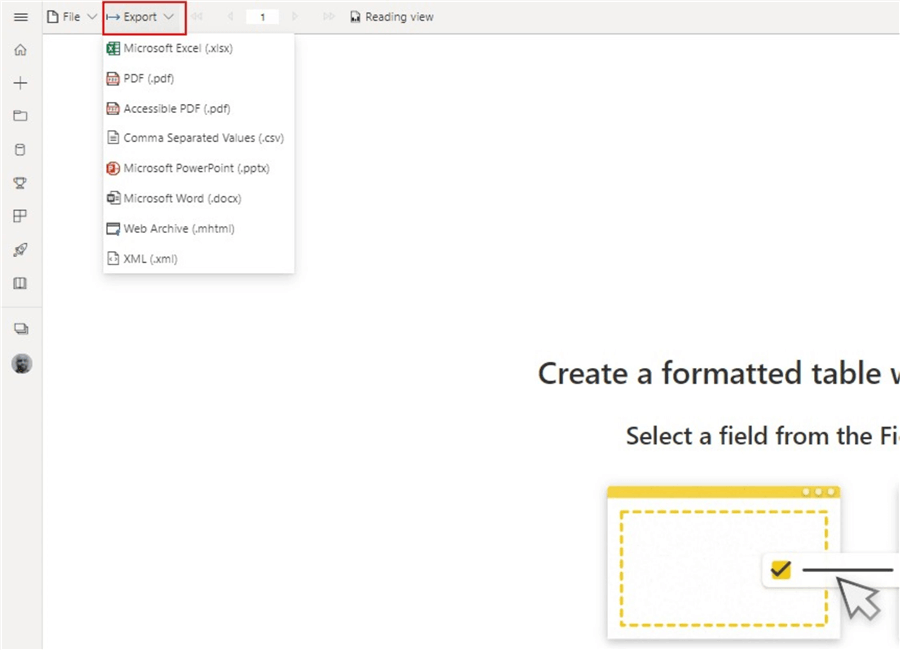
You can also export the formatted table as shown below.
Or you can also save the report as a paginated report where you have further options on how you can adjust the page settings, share the paginated report, subscribe to the paginated report, you could also generate an embed code or link for the report, and you can further edit the report in a Power BI report builder.
Note: Each report (either paginated or standard reports) created and saved using this dataset within the preview data page would be listed within this page too.
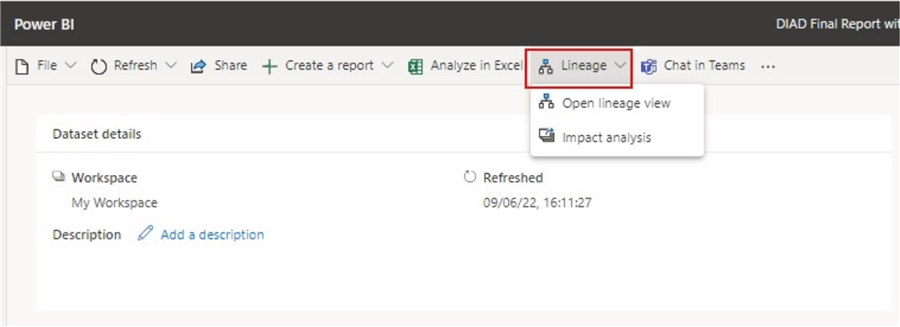
View Lineage and Monitor Impact Analysis on Dataset
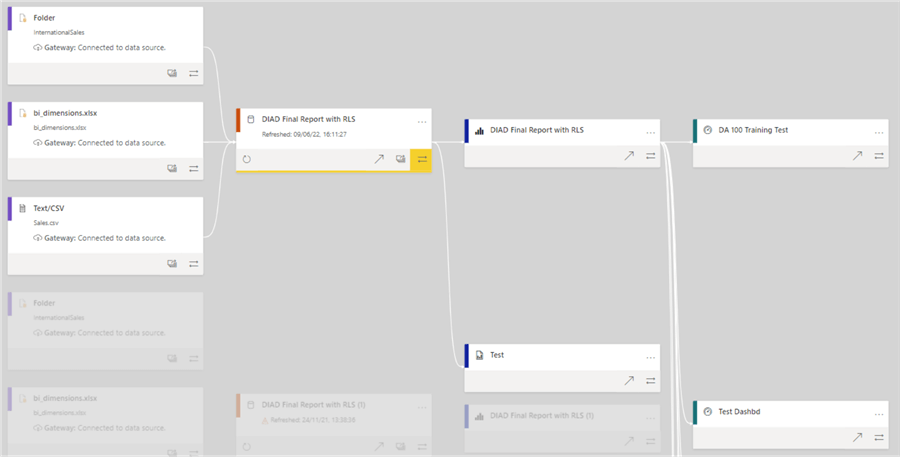
You can view all dependencies on this dataset from the source to all reports and dashboards as seen in the diagram below.
To do this, you just need to click on the dropdown on the preview data page and select either "Open lineage view" or "Impact analysis" as shown below.
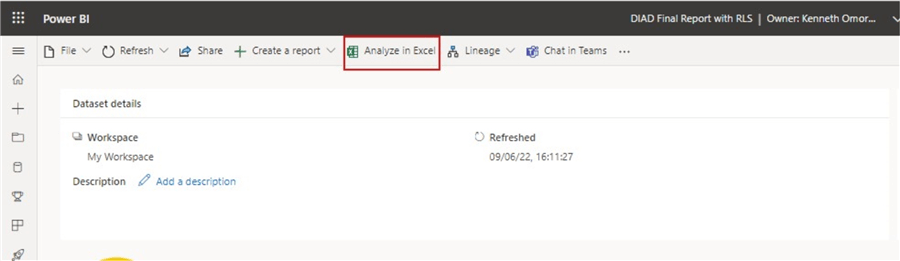
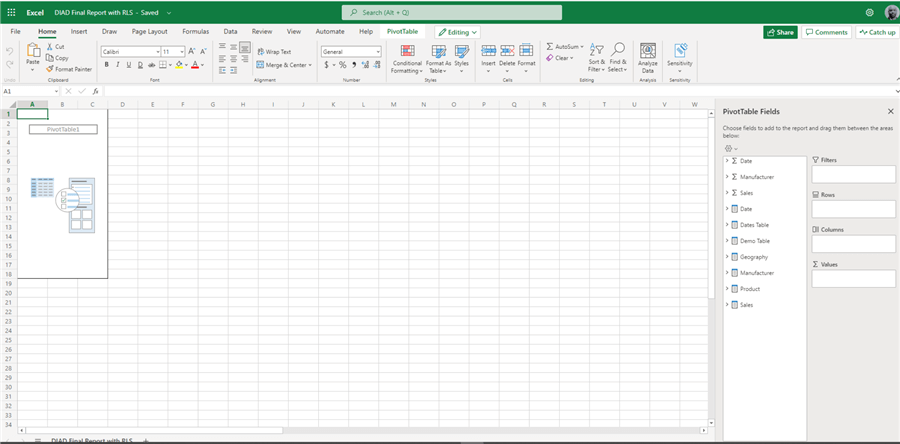
Analyze Dataset in Excel
You can also take the dataset to Excel and perform analysis there. To do this, click on the "Analyze in Excel" on the preview data page as seen below.
This should open an Excel Online page where a Pivot Table has been created using the tables in the underlying dataset you are previewing. See below for an example of the Pivot Table created by triggering the Analyze in Excel section.
As this is a very new feature released by the Power BI team, many updates should follow soon. However, this article is aimed at introducing how you can use this feature. I am quite sure after reading this article, you can figure out more things to use the preview data page for in your business.
Next Steps
- You can learn more about Preview Data from the Power Community page here.
- See the Microsoft documentation on dataset details page here.
- For more information on data discovery in the data hub check here.
- Try this tip out in your own environment.
Learn more about Power BI in this 3 hour training course.


About the author
 Kenneth A. Omorodion is a Business Intelligence Developer with over eight years of experience. He holds both a bachelor’s and master’s degree (Middlesex University in London). Kenneth has the MCSA, Microsoft Data Analyst - Power BI and Azure Fundamentals certifications. Kenneth is a Microsoft Certified Trainer and has delivered corporate training on Power BI, SQL Server, Excel and SSRS.
This author pledges the content of this article is based on professional experience and not AI generated.
View all my tips
Article Last Updated: 2022-07-19
