By: Rajendra Gupta | Updated: 2022-08-18 | Comments | Related: > Azure Data Studio
Problem
Database professionals use execution plans for troubleshooting and optimizing SQL queries. SQL Server Management Studio (SSMS) provides estimated and actual graphical and XML execution plans, a popular tool for DBAs. Azure Data Studio is a new developer-friendly tool for working with SQL Server and Azure. If you use Azure Data Studio, you should know how to use its features for performance optimization of SQL queries. Let's check out how to do this in this tip.
Solution
In previous Azure Data Studio tips, we explored how Azure Data Studio supports installation on Windows, Linux (RedHat, SUSE, Ubuntu), and macOS. Azure Data Studio is an open-source tool especially for Linux or macOS users to work with SQL Server.
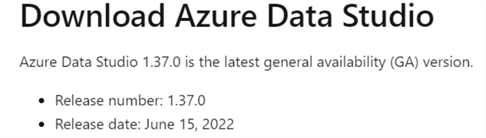
This article uses Azure Data Studio's latest general availability (GA) release number 1.37.0, released on June 15th, 2022.
Let's explore the query plan viewer in Azure Data Studio.
Azure Data Studio – Query Plan Viewer
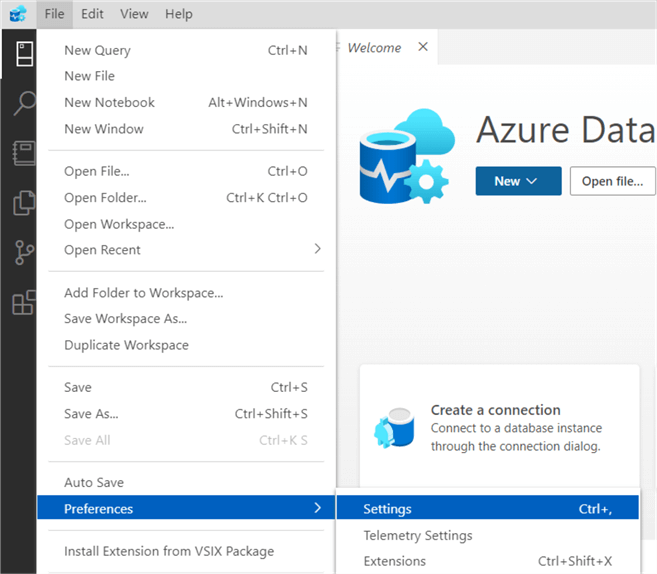
Query Plan Viewer is a preview feature of Azure Data Studio, version 1.35 or later. Launch Azure Data Studio and click on File > Preferences > Settings to enable the feature.
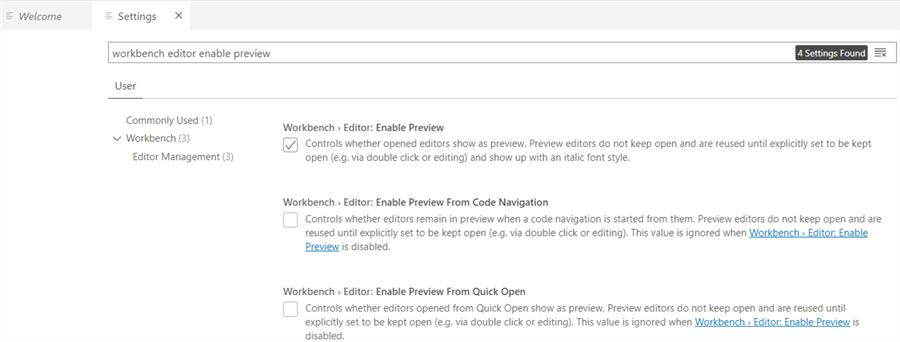
In Settings, type the following text: workbench editor enable preview and enable this preview.
Once the preview feature is enabled, we can connect to a SQL Server database and execute a query to get the query plan (preview).
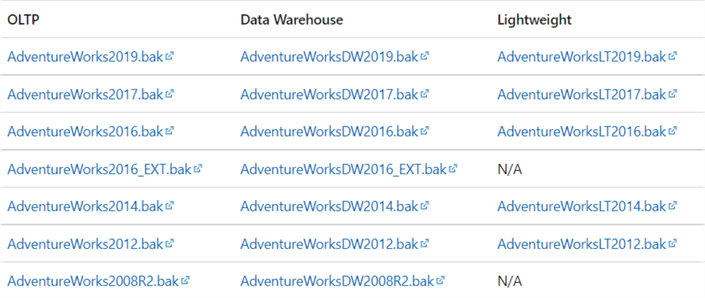
Before proceeding, I downloaded the AdventureWorksLT2019 database backup file and restored it to my local SQL instance. You can download the required sample database from the download backup files. Here is a list of what is available.
Launch the database restore wizard from the Azure Data Studio server dashboard and specify the backup file and destination database name as shown below.
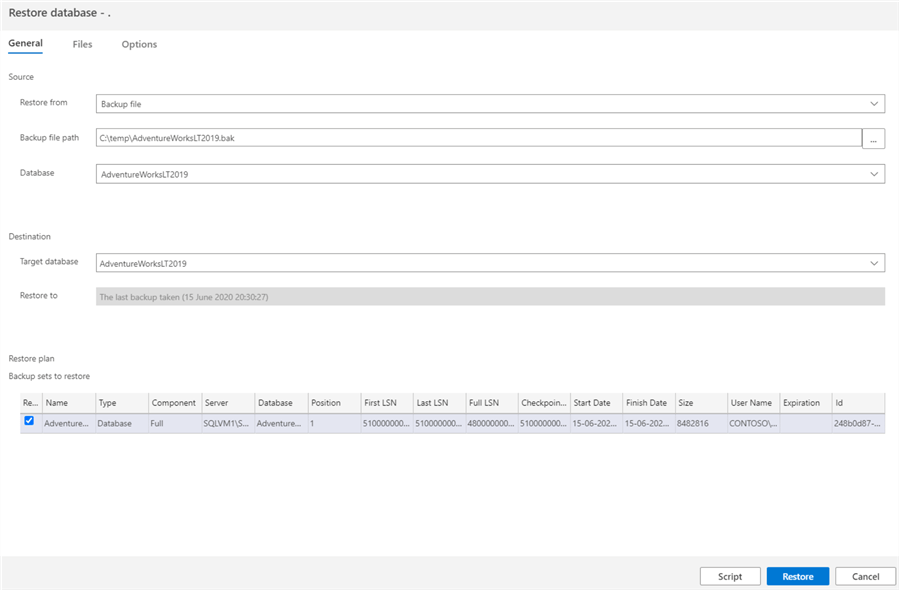
Click on Restore and after the restore you will see the new sample database [AdventureWorksLT2019] as shown below.
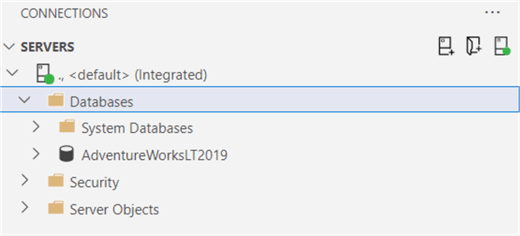
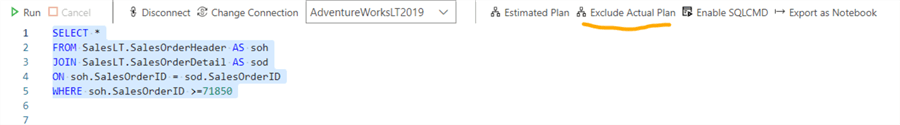
Right-click on database [AdventureWorksLT2019] and select New Query. In the new query editor, paste the following T-SQL.
SELECT *
FROM SalesLT.SalesOrderHeader AS soh
JOIN SalesLT.SalesOrderDetail AS sod
ON soh.SalesOrderID = sod.SalesOrderID
WHERE soh.SalesOrderID >= 71850
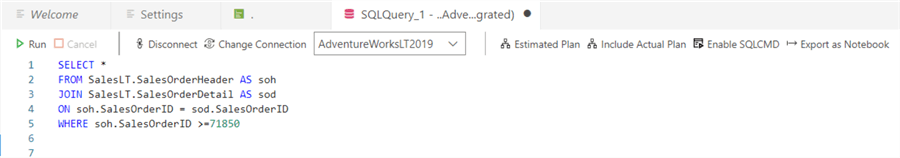
Click Run and it shows the query results.
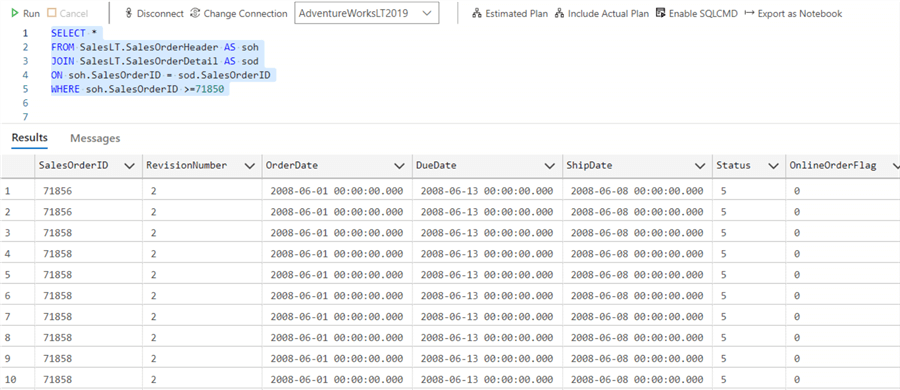
However, we did not get a query execution plan. To get the query execution plan, we need to choose either 'Estimated Plan' or 'Include Actual Plan' from the query editor.
Let's say we want to see the actual execution plan to get query runtime execution steps and values. Once you click on 'Include Actual Plan,' the option changes to 'Exclude Actual Plan.'
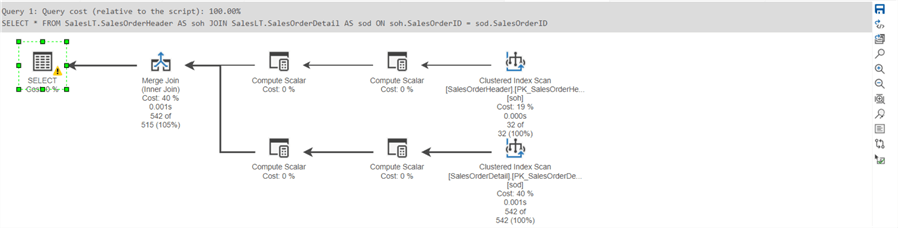
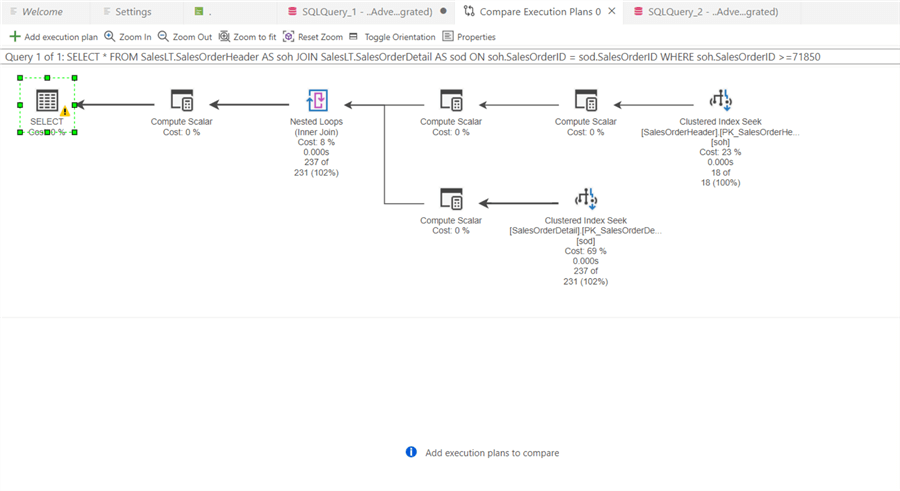
Rerun the SQL statement and this time we get the actual execution plan in a separate tab – Query Viewer (Preview).
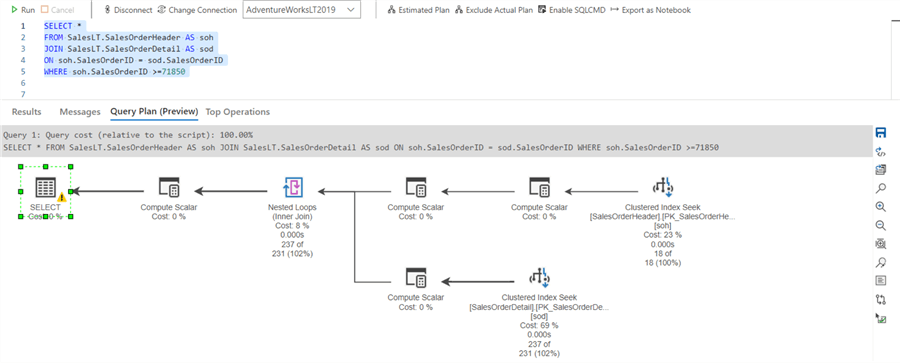
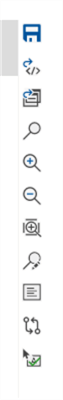
In the query plan (preview), notice the toolbar on the right, as shown below.
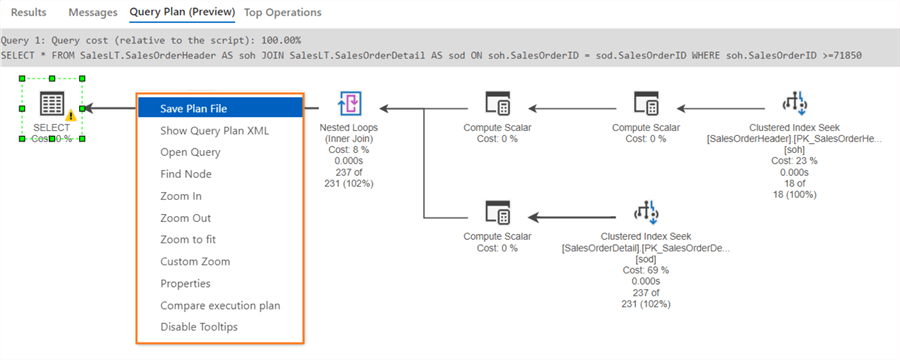
You can get these options in a text format if you right-click anywhere on the execution plan window.
These are various options to help analyze the query execution plan. Let's explore these toolbar options from top to bottom.
- Save Plan File: You can save the execution plan to a specified directory for analysis. You do not need to execute the query to view the execution plan again. Go to the specific directory and open the saved plan. You can save the execution plan with the extension sqlplan. To open a saved execution plan, go to File > Open file and click on the saved plan. It opens the saved execution plan with all properties, as shown below.
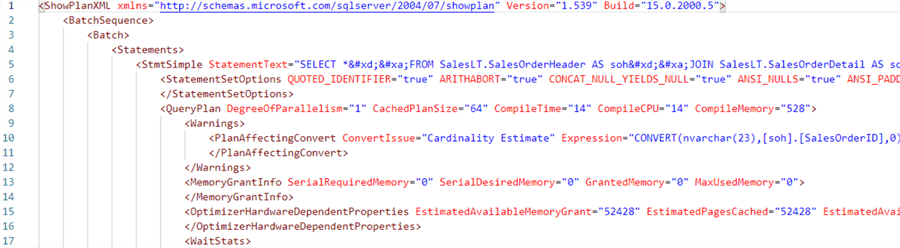
- Show Query Plan XML: Some experienced DBAs prefer query XML plans instead of the graphical plan for performance troubleshooting. Clicking on the show query plan XML option opens a new tab with the query XML plan as shown below.
- Open Query: The available query option opens a new query editor for the query that generated the execution plan.
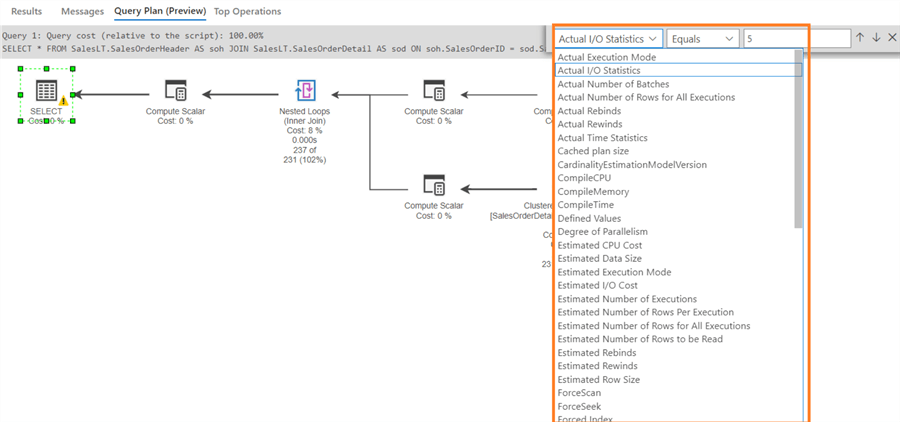
- Find Node: The Find Node option allows you to search through execution plan properties. It lets you quickly point out specific thresholds or configurations in an extended execution plan. Click on Find Node to search for the execution plan, which opens different parameters.
- Zoom: Azure
Data Studio Query Plan (Preview) has zoom capabilities to customize your view
of the execution plan.
- Zoom In
- Zoom out
- Zoom to fit
- Custom zoom
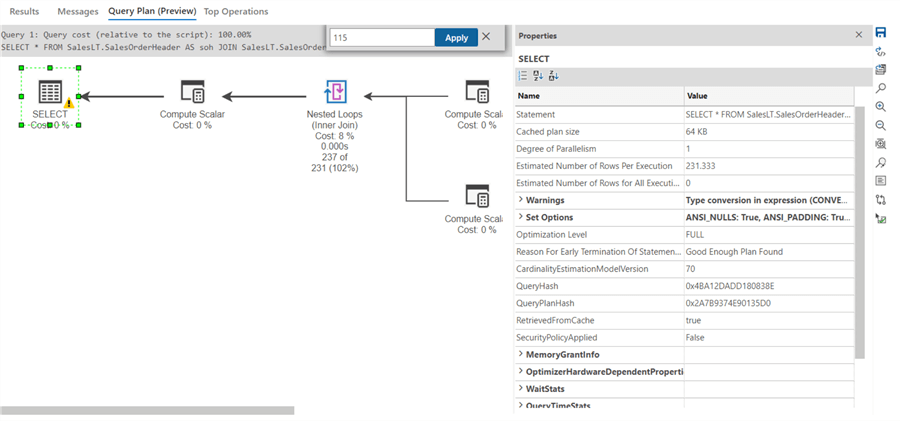
- Properties: The Properties option gives detailed information about the selected operator in the execution plan. For example, in the following screenshot, we get SELECT statement properties, optimization level, Memory Grants, stats, warnings, set options, etc.
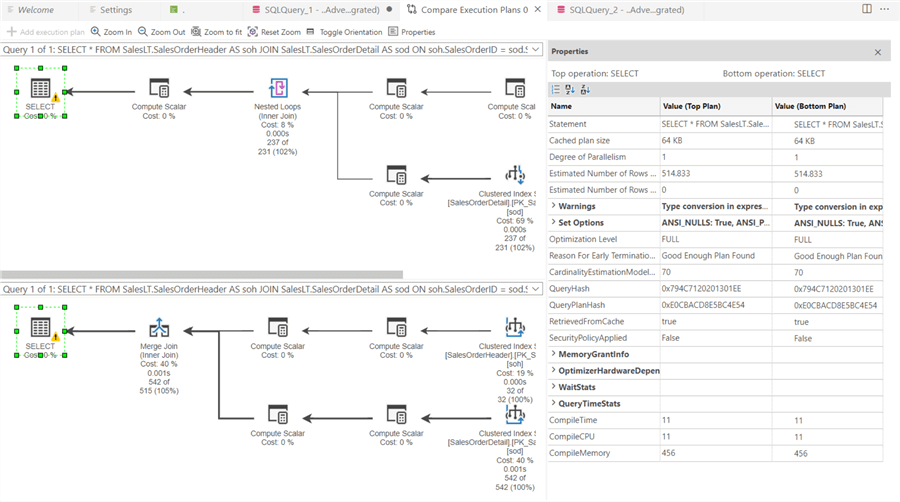
- Compare Execution Plan: You can compare two execution plans in the Azure Data Studio Query Plan (Preview). For a saved execution plan, click on the option that asks you to add an execution plan to compare. The top execution plan is the generated plan after executing the query.
- Click on Add execution plan and provide a path for an earlier saved execution plan. Now, you can compare two execution plan properties in a tabular format comparison as shown below. These execution plan comparisons help to tune the SQL statements by assessing various parameters before and after making changes.
- Tooltip Enabled or Disabled: You might be familiar with the SQL Server Management Studio execution plan tooltip. The tooltip provides additional details of an execution plan component if you hover the mouse over it. Azure Data Studio provides an option to enable or disable the tooltip. By default, the tooltip is enabled for all users. Disabling the tooltip is helpful, especially when navigating an execution plan with numerous operators.
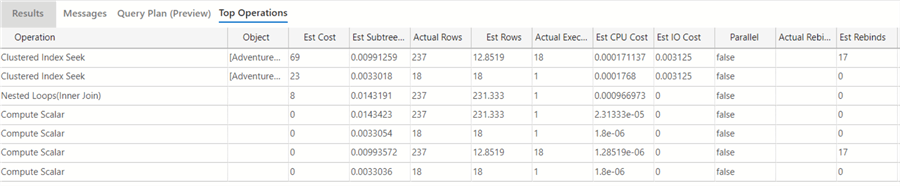
- Top Operations: Sometimes, it is challenging to identify the top-cost operation that requires attention in a complex execution plan. It is not feasible to check each operator's properties and record their parameter values. Therefore, Azure Data Studio lists top operations in the executed SQL statement. We get a tabular-format top operations list with estimated and actual data as shown below.
Note: The Query Plan is a preview feature of Azure Data Studio. Therefore, you may notice a few hiccups while using it. These issues will be fixed before the general availability of the query plan feature in the upcoming releases.
Next Steps
- Read existing tips on Azure Data Studio.
- You can use performance tuning tips to see how execution plans can help you troubleshoot and optimize SQL query execution.


About the author
 Rajendra Gupta is a Consultant DBA with 14+ years of extensive experience in database administration including large critical OLAP, OLTP, Reporting and SharePoint databases.
This author pledges the content of this article is based on professional experience and not AI generated.
View all my tips
Article Last Updated: 2022-08-18
