By: Koen Verbeeck | Updated: 2023-07-10 | Comments | Related: > Power BI
Problem
Artificial intelligence (AI) is all over the news nowadays and doesn't seem to slow down. It appears AI is getting implemented everywhere, with many new services being created each day. I'm wondering, though, does Power BI have any AI capabilities?
Solution
In this tip, we'll try to give an overview of particular AI possibilities within Power BI (either the Power BI service or Power BI Desktop). This is not an exhaustive list (and a follow-up tip is planned with even more features) since the world of AI is continuously evolving. And Microsoft is investing heavily in the OpenAI platform and integrating its models within its products/services. As usual, remarks or comments are welcome in the comments section to keep the conversation going.
AI Capabilities in Power BI
Power BI Q&A
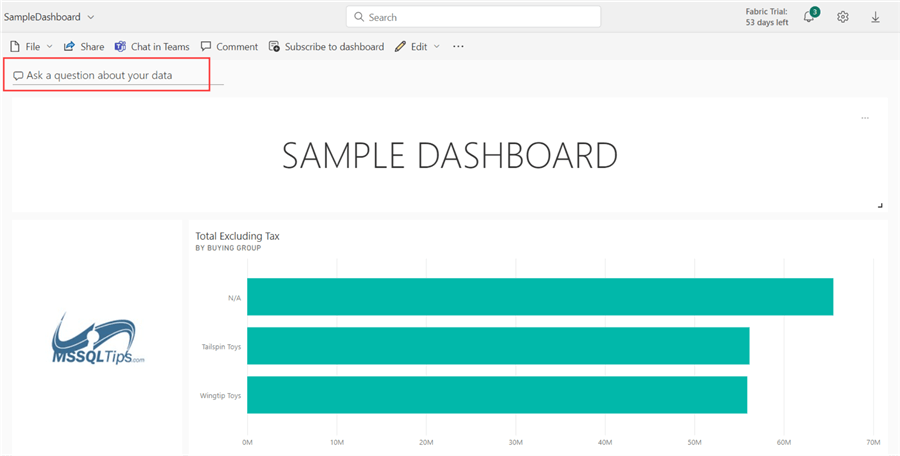
Let's start with a feature that has been around in Power BI for years: the Q&A feature or the "natural language query." When you have a Power BI dataset in the Power BI Service and a dashboard using it, you can ask questions about the data, and the service will try to answer them.
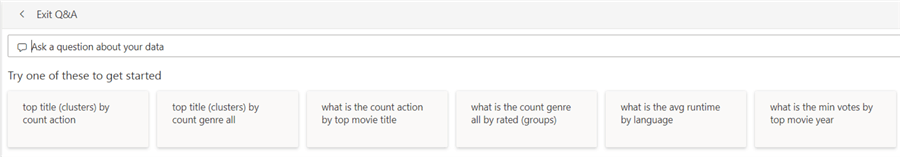
When you click on the text box to ask a question, you're presented with a couple of possible questions that Power BI generated for you:
When you ask a question, you'll get the result in a visual:
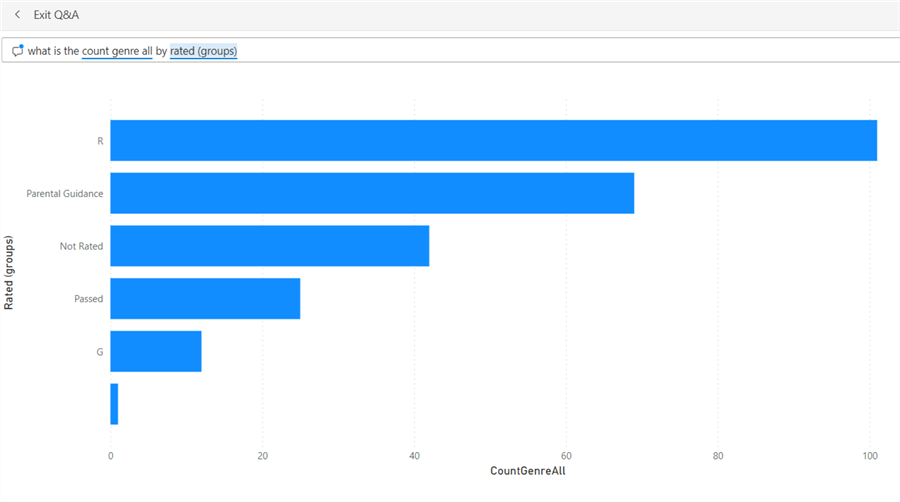
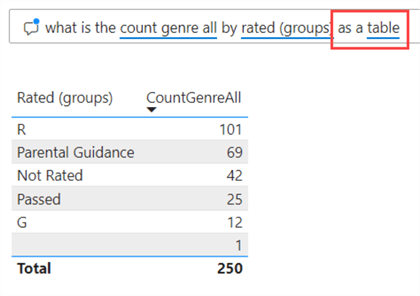
You even have the option to pin this visual to your dashboard. The visual type depends on what Power BI thinks is an appropriate type for the data returned, but you can change it in the question itself:
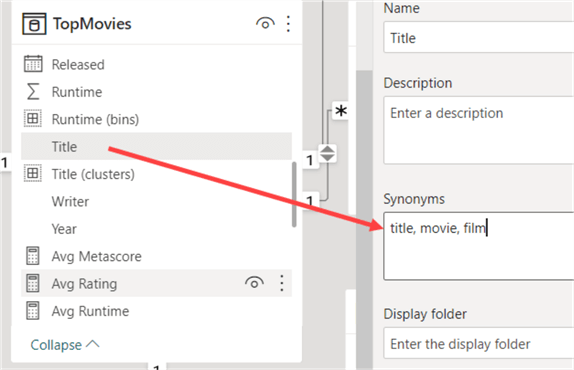
You can enhance the "correctness" of the language model behind Q&A by specifying synonyms in Power BI Desktop. For example, one person might use "movie," while another might use "film." Both define the same object within the Power BI model.
To learn more about the Q&A feature in Power BI, check out the excellent series written by MSSQLTips.com author Scott Murray:
- Power BI Q & A Example and Demo
- Power BI Advanced Q&A
- Power BI Advanced Q & A Techniques
- Power BI Q&A Linguistic Schema
Power BI Quick Insights
Every time you publish a Power BI Desktop file – with imported data – to the Power BI service, you get the following message if publishing was successful:
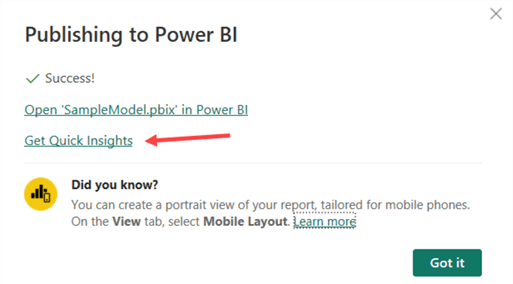
You can open the dataset in the Power BI service, but you can also go to the Quick Insights page. When you click the link, you're taken to the Power BI service, where a page is generated.
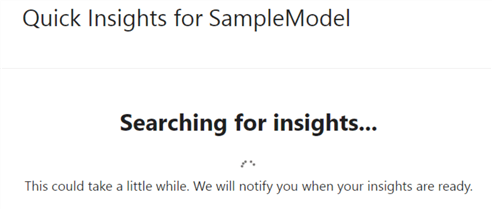
This can take a little while, depending on the size and complexity of your dataset. When the page is ready, you'll get auto-generated visuals of your data.
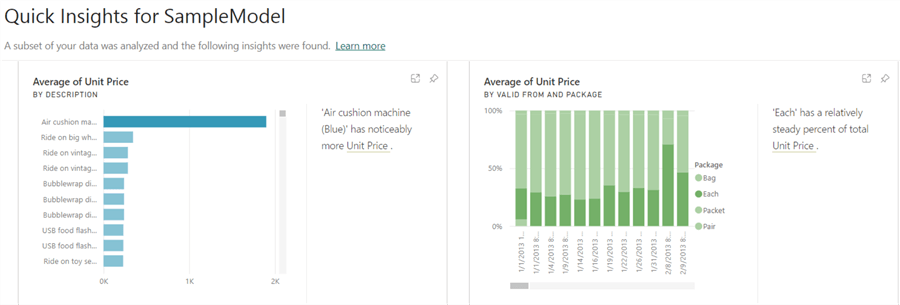
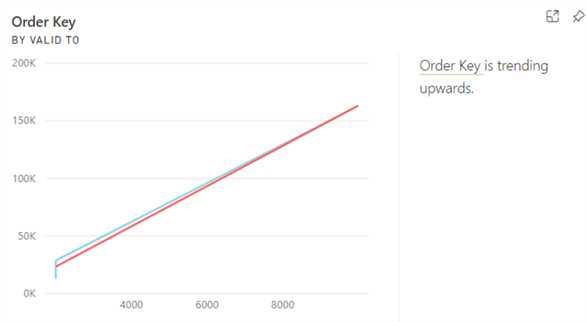
Some visuals might have interesting information and give you a good insight into your data, but others might not. For example, it's only logical that the always-incrementing order key column (an IDENTITY column in SQL Server) is trending upwards:
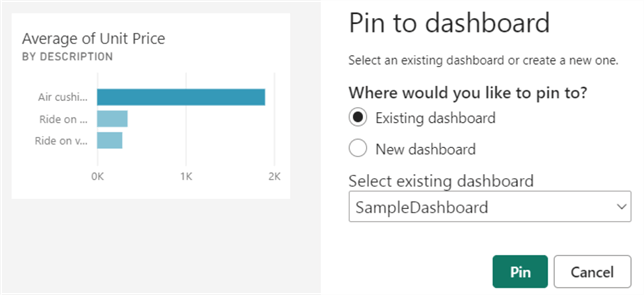
As mentioned in the tip, How can AI make IT more efficient?, AI is not infallible. It's always up to you to verify the results. If you see a visual on the Quick Insights page that is particularly useful, you can pin it to dashboards just like in the Q&A feature.
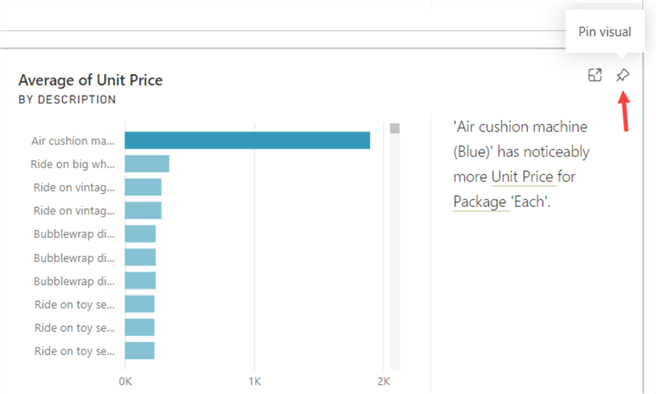
You can pin the visual to an existing dashboard or create a new one. Remember, you'll only pin the visual itself and not the generated text at the right of the visual.
This feature doesn't work with DirectQuery, streaming, or Push datasets. It also doesn't support row-level security. There are some tips to get the most out of the Insights feature:
- Power BI doesn't search through hidden columns, so hide any uninteresting or irrelevant columns and make sure interesting columns are not hidden. We should have hidden the "order key" column in the example used above.
- Avoid duplicate columns or columns with redundant information, confusing the algorithm when searching for meaningful patterns. For example, a column with the city name and another with location info will show a correlation, which is evident to us but not to an algorithm.
- Have a mix of different data types, such as names, times, dates, and numbers.
- Sometimes, you might get a message that the data isn't statistically significant. This might happen if the data model is too simple, there's not enough data, or there are no date or numeric columns.
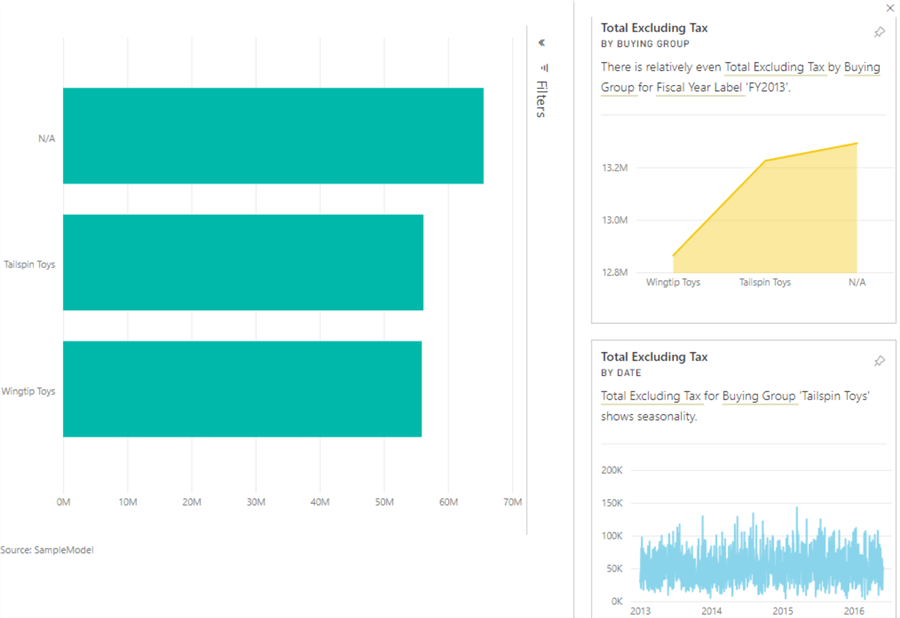
Another method to get auto-generated insights is when interacting with dashboard tiles in the Power BI service. When you click on the ellipsis for a dashboard tile, you can ask Power BI to generate insights (referred to as Dashboard Insights):
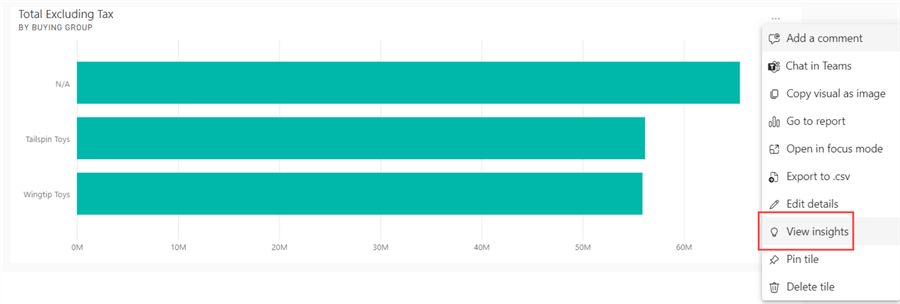
Like before, Power BI will generate a couple of visuals for you, but this time they will be more related to the data used in the dashboard tile. In the example, all the visuals use the Total Excluding Tax measure. The dashboard tile will go into Focus Mode, and the generated visuals are shown in a sidebar on the right. Like before, you can pin any visual to a dashboard.
Aside from Insights on datasets (when publishing from Power BI Desktop) or dashboard tiles, you can also get Insights on a report page. In the Power BI Service, click Get Insights in the menu to get a sidebar with auto-generated visuals (again with accompanying text).
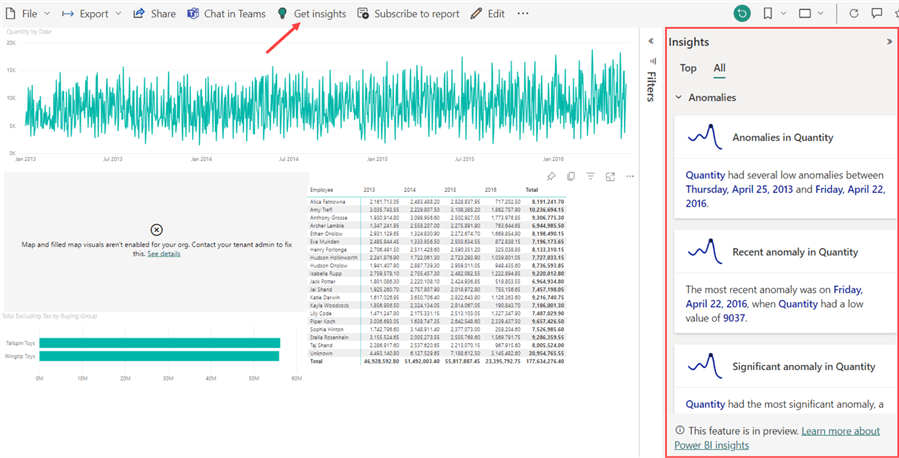
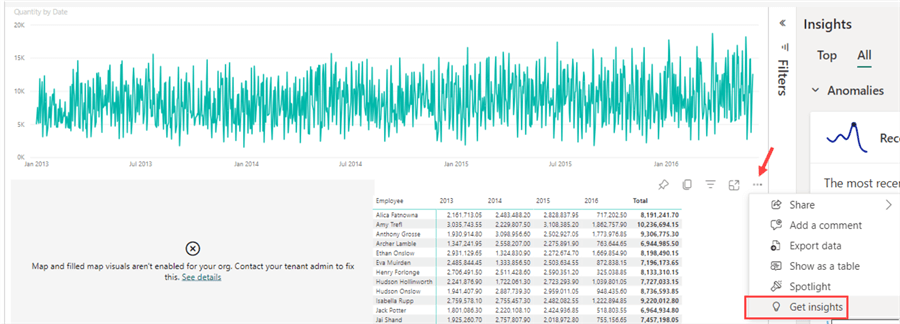
Like a dashboard tile, you can generate insights for a specific visual only. Click on the ellipsis to find it in the context menu:
This feature is currently in preview, and according to the documentation, it's a Premium feature, which means you need either a workspace in a Premium capacity or a Premium-per-user (PPU) license. As of writing, it's unclear how this feature will be supported in Microsoft Fabric.
Next Steps
- If you're interested in the types of algorithms used by the Insights feature, check out the documentation page Types of insights supported by Power BI.
- Compare Power BI Desktop vs. Power BI Online
- Power BI Dashboard vs Report vs Workbook
- Power BI Datasets
Learn more about Power BI in this 3 hour training course.


About the author
 Koen Verbeeck is a seasoned business intelligence consultant at AE. He has over a decade of experience with the Microsoft Data Platform in numerous industries. He holds several certifications and is a prolific writer contributing content about SSIS, ADF, SSAS, SSRS, MDS, Power BI, Snowflake and Azure services. He has spoken at PASS, SQLBits, dataMinds Connect and delivers webinars on MSSQLTips.com. Koen has been awarded the Microsoft MVP data platform award for many years.
This author pledges the content of this article is based on professional experience and not AI generated.
View all my tips
Article Last Updated: 2023-07-10
