By: Edwin Sarmiento | Updated: 2024-04-25 | Comments | Related: > Availability Groups
Problem
We experienced several unplanned outages and failovers on our SQL Server Always On Availability Groups. We want to know the root cause to prevent them from happening in the future. How do we identify the root causes of unplanned Availability Group outages and failovers?
Solution
The goal of deploying an Always On Availability Group is to provide high availability to SQL Server databases. So, it becomes problematic when an unplanned outage or unexpected failover happens more often than necessary. You need to troubleshoot the issue and find the root cause to prevent it from happening again. The first step in troubleshooting an issue is to collect as many logs as possible for analysis.
The challenge with a complex architecture like Always On Availability Groups is that there are so many moving parts with different components that can each contribute to the issue. Part of that challenge is collecting logs from various sources like SQL Server error logs, AlwaysOn_health Extended Events sessions, Windows Event Logs, and Windows Server failover Cluster logs. On top of that, you need to make sure that you've collected enough logs from each of those sources at the same time within the same time frame for proper analysis.
Fortunately, Microsoft technical support engineers developed a tool for this purpose - SQL LogScout. SQL LogScout is mentioned in this Microsoft documentation as one of the tools for troubleshooting SQL Server on-premises and hybrid scenarios. It is a light, script-based, open-source tool that allows you to collect diagnostic logs from your SQL Server system to help troubleshoot problematic issues faster. It makes the log collection process across many different components a lot easier. While you can use it to analyze logs for a variety of SQL Server issues, this tip will focus on using SQL LogScout to identify the root causes of unplanned Availability Group outages and failovers.
Download and Install SQL LogScout
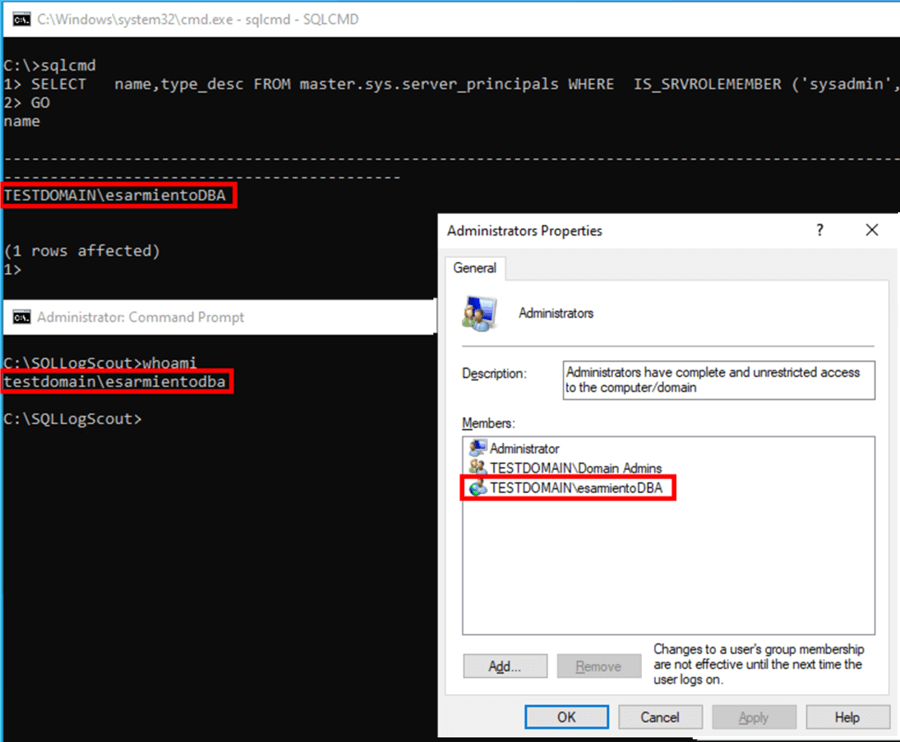
To get started, download SQL LogScout from its GitHub repository. SQL LogScout is a compilation of PowerShell scripts, T-SQL scripts, and batch files. That being said, you need PowerShell version 4.0 or higher. You also need to configure the script execution policy to RemoteSigned using the Set-ExecutionPolicy cmdlet to run PowerShell scripts as described in this tip. Since it will collect logs from Windows Server Failover Cluster, Windows Event Log, system information, etc., you need local Administrator privileges on the server running the Availability Group primary replica in addition to your existing sysadmin privileges on the SQL Server instance (VIEW SERVER STATE and ALTER ANY EVENT SESSION are the minimum permissions needed for the data collection on the SQL Server side).
Extract the compressed file to any location on the primary replica of your Availability Group. We will be using C:\SQLLogScout for this tip. Open an Administrative command prompt and navigate to this folder. Note that the account I'm using has local Administrator privileges on the server and sysadmin privileges on the SQL Server instance running the Availability Group primary replica.
SQL LogScout to Collect Logs for Analyzing Unplanned Availability Group Outages and Failovers
SQL LogScout can be used to collect logs for a variety of SQL Server issues. This tip will only focus on Availability Group outages and failovers. The good thing about using SQL LogScout to analyze and identify root causes of unplanned Availability Group outages and failovers is that you can do this even after the issue has occurred and has been resolved. Just make sure you keep enough logs – SQL Server error logs, AlwaysOn_health Extended Events sessions, Windows Server Failover Clustering logs, Windows Event Logs, etc. - so you have something to work on.
NOTE: In most cases, the focus of all activities during an outage is to bring the databases, Availability Groups, and/or the Windows Server Failover Cluster online as quickly as possible. Root cause analysis becomes less of a priority when everything returns to normal. If you have a very busy system or have not properly configured to keep the logs long enough to analyze, such as recycling the SQL Server error log daily, you may not have any logs to work with. I've worked on dozens of cases where I couldn't do a root cause analysis because we no longer have the logs when the issue happened - either they've already been recycled or overwritten. Sometimes, it's been weeks after the issue occurred before the customer decided to do a root cause analysis. Make it a part of your incident management process to do a root cause analysis as soon as everything is back to regular business operation.
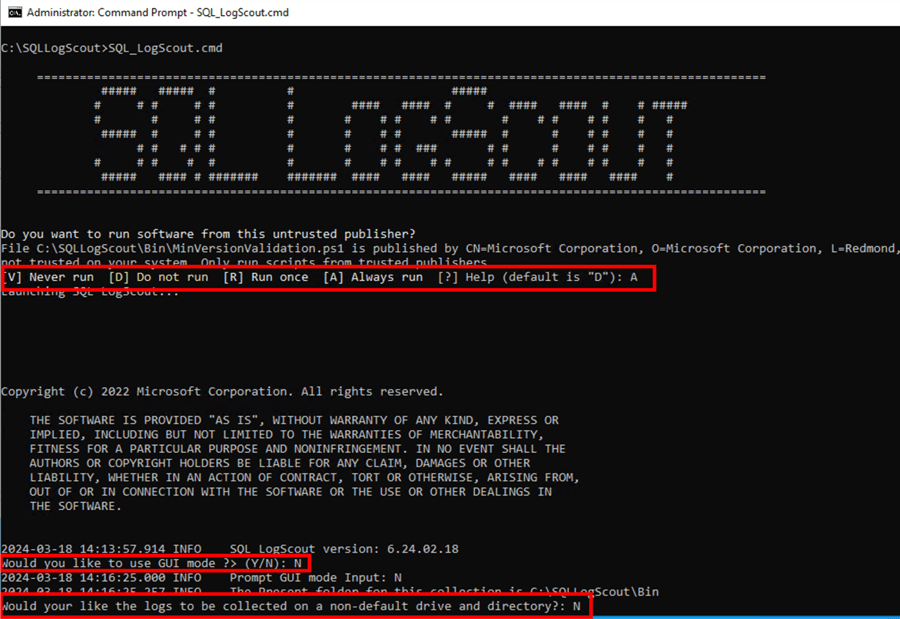
Assuming that an unplanned Availability Group outage or failover has already occurred, run the batch file, SQL_LogScout.cmd, on the primary replica (or the original primary replica if an automatic failover occurred) of the Availability Group.
- When prompted to allow execution of the PowerShell scripts, type A and press Enter. This will run all the PowerShell scripts without additional prompts.
- When prompted to use GUI mode, type N and press Enter. This will keep SQL LogScout running in command-prompt mode.
- When prompted to use a non-default drive and directory, type N and press Enter. This will save all the collected logs inside the C:\SQLLogScout\output directory.
This is where you start to see the power of SQL LogScout. It will collect logs based on different scenarios you provide, which are provided on the SQL LogScout GitHub page. Since this tip aims to collect logs to analyze unplanned Availability Group outages and failovers, limit it to that scenario.
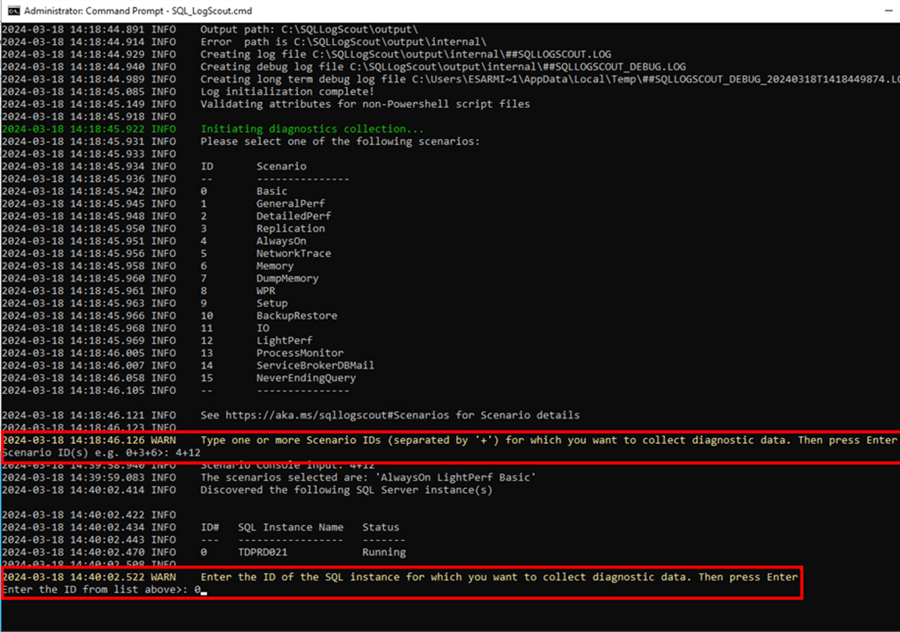
- When prompted for the scenario, type 4+12 and press Enter. The value 4 is for the AlwaysOn scenario. It will collect Availability Group-related logs from SQL Server error logs, AlwaysOn_health Extended Events session, Availability Group diagnostic information from DMVs, Windows Server Failover Cluster logs, etc. The value 12 is for the LightPerf scenario and will collect light performance data for an overall system performance view. This does not include detailed information such as query execution plans and the like. By default, it will also run the Basic scenario (the value 0) to collect static logs.
- When prompted for the ID of the SQL Server instance, type the corresponding number and press Enter. You may have multiple SQL Server instances running on this server. Be sure to provide the ID of the SQL Server instance running the Availability Group you want to analyze. In this example, I'm using ID 0 for the instance TDPRD021.
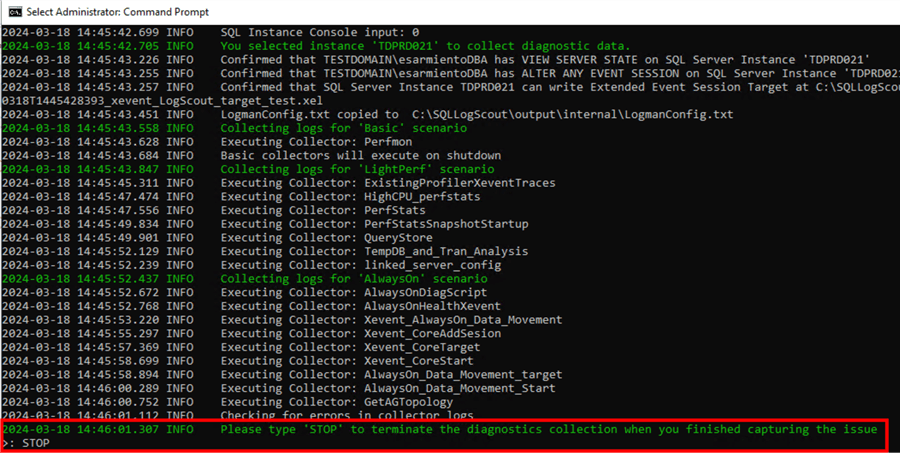
Since the issue has already occurred, you're collecting the logs containing the events for analysis. Type STOP and press Enter when you see the prompt to terminate the diagnostics collection. This stops the log collection and terminates the execution of SQL LogScout.
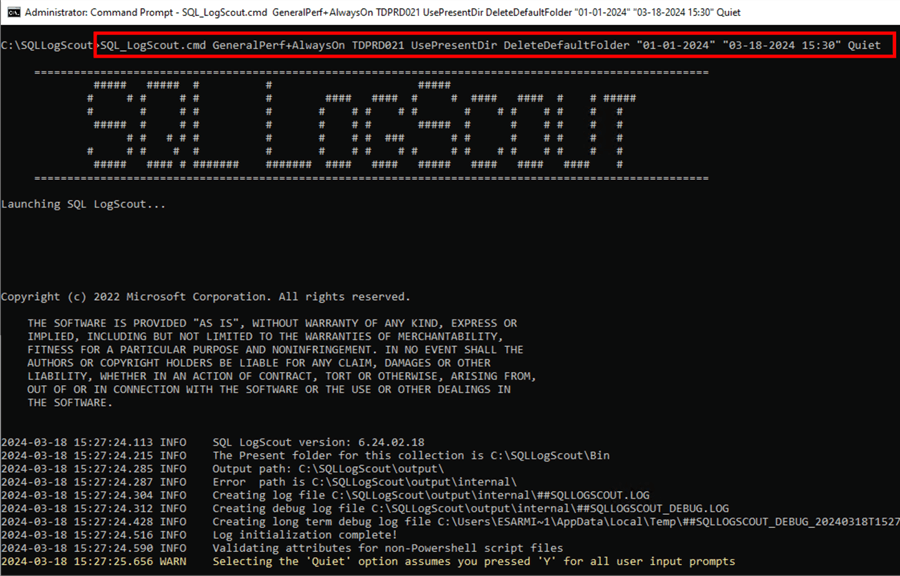
If you want to automate the process of running SQL LogScout or simply want a consistent, standardized command, run the command below containing the parameters you provided.
SQL_LogScout.cmd AlwaysOn+LightPerf TDPRD021 UsePresentDir DeleteDefaultFolder "01-01-2024" "03-18-2024 15:20" Quiet
- AlwaysOn+LightPerf: The AlwaysOn and LightPerf scenarios. Names are used instead of the equivalent numerical values.
- TDPRD021: The SQL Server instance name; used instead of the equivalent numerical value.
- UsePresentDir: Use the current directory. This is equivalent to responding N to using the non-default drive and directory.
- DeleteDefaultFolder: Used to delete the default \output folder, if present.
- "01-01-2024": Used to set the start time in the past to ensure the data collection starts without delay.
- "03-18-2024 15:20": Used to set the stop time in the future with enough time for the data collection to run properly.
- Quiet: Used to accept all the prompts automatically and not require user input.
Reviewing Collected Logs
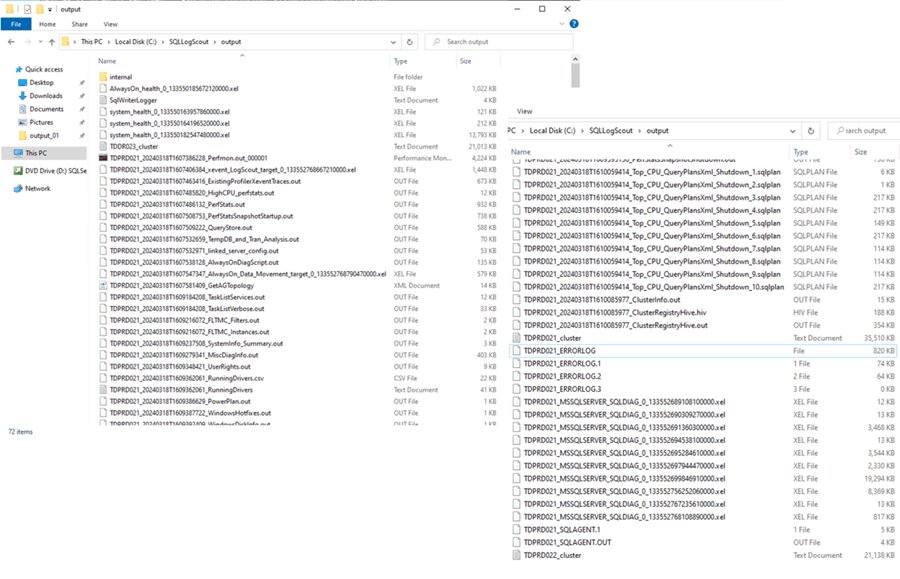
Navigate to the C:\SQLLogScout\output directory to view the collected logs. Notice the logs collected: AlwaysOn_health Extended Events session, system_health Extended Events session, Windows Server Failover Cluster logs, SQL Server error logs, SQLDIAG Extended Events session, Perfmon log, Windows Event Logs, etc.
SQL LogScout makes it easier to collect all the logs from different sources and consolidates them in a single repository for easier analysis. You can use these collected logs to analyze the root cause of unplanned Availability Group outages and failovers. Although it can be tedious to go through each log manually, decipher error messages, and investigate potential root causes of the issues, there is not an easier way to do so.
The next tip will cover how to process these logs using another open-source tool from Microsoft, which makes analyzing unplanned Availability Group outages and failovers much easier.
Next Steps
- Read more about SQL LogScout from the GitHub repository.
- Download and install SQL LogScout.
- Start collecting logs using SQL LogScout to identify the root causes of unplanned Availability Groups outages and failovers.
- Read this Microsoft documentation on Troubleshooting and diagnostic tools for SQL Server on-premises and hybrid scenarios.


About the author
 Edwin M Sarmiento is a Microsoft SQL Server MVP and Microsoft Certified Master from Ottawa, Canada specializing in high availability, disaster recovery and system infrastructures.
This author pledges the content of this article is based on professional experience and not AI generated.
View all my tips
Article Last Updated: 2024-04-25
