By: Ray Barley | Comments (19) | Related: > Reporting Services Monitoring
Problem
We have SQL Server Reporting Services (SSRS) 2005 running on a single server that supports a large user base. There are specific times during the month where the response time is not acceptable. Based on performance data that we have gathered we have been able to pinpoint the times when the server is extremely busy. What we haven't been able to figure out is what reports were running and who was running those reports. In this tip, I will go over some of the logging mechanisms available in SSRS to answer these questions.
Solution
SSRS has a built-in logging capability that can provide the information that you need. The ReportServer database has a table named ExecutionLog which contains the following columns:
COLUMN_NAME DATA_TYPE ---------------------------------------- ---------------------------------------- InstanceName nvarchar ReportID uniqueidentifier UserName nvarchar RequestType bit Format nvarchar Parameters ntext TimeStart datetime TimeEnd datetime TimeDataRetrieval int TimeProcessing int TimeRendering int Source tinyint Status nvarchar ByteCount bigint RowCount bigint |
The column names are pretty self-explanatory. You can get the report name from the Name column in the Catalog table by joining the ExecutionLog.ReportID to Catalog.ItemID. However, you need to check if the built-in logging is enabled and how long the data is being retained. To do that please refer to our earlier tip Logging Options for Reporting Services 2005.
The amount of data collected in the ExecutionLog table will grow steadily on a busy server. In order to conserve space you will want to retain only a small amount of history. However, you would like to be able to go back and see over time how report usage patterns are changing. The logical next step is to periodically extract data from the ReportServer database, transform it into a dimensional model, and load it into a data mart on another server to support analysis, ad-hoc queries, and reporting. You can pickup a nice example of how to do this in the SQL Server 2005 samples available on the Code Plex site. Assuming you installed the samples in the default location, you will find the sample in the following folder:
C:\Program Files\Microsoft SQL Server\90\Samples\Reporting Services\Report Samples\Server Management Sample Reports\Execution Log Sample Reports
The sample includes the following:
- Createtables.sql - a T-SQL script to create the the tables for the data mart. You should create a new database then execute this script in your new database.
- Cleanup.sql - a T-SQL script to purge data from the data mart that is older than a specified report time start.
- RSExecutionLog_Update.dtsx - a SQL Server Integration Services (SSIS) package that you can run to periodically extract data from the ReportServer, transform it, and load it into the data mart.
- Execution Summary SSRS Report - for a user-defined date range, shows report execution statistics such as total reports run, average reports run, number of successful reports, number of failed reports; also shows charts of report executions per day and week; shows top 10 of report users, most executed, longest running and largest reports.
- Report Summary SSRS Report - drilldown for the Execution Summary Report.
Data Mart Schema
The Createtables.sql script creates the following schema for the data mart:
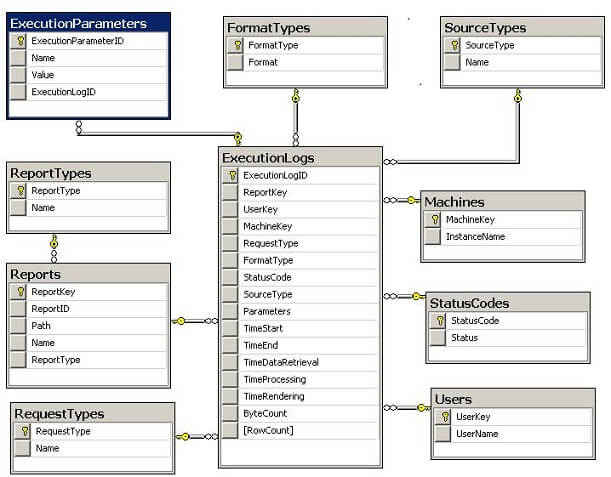
This is the typical star schema that we would expect. There is no calendar dimension which would be convenient for analyzing reports run on weekends, holidays, etc. The various dimensions can easily be used to populate dropdown boxes for report parameters, allowing you to filter by report, report type, format type, user, etc.
SSIS Package
The control flow for the SSIS package is shown below:
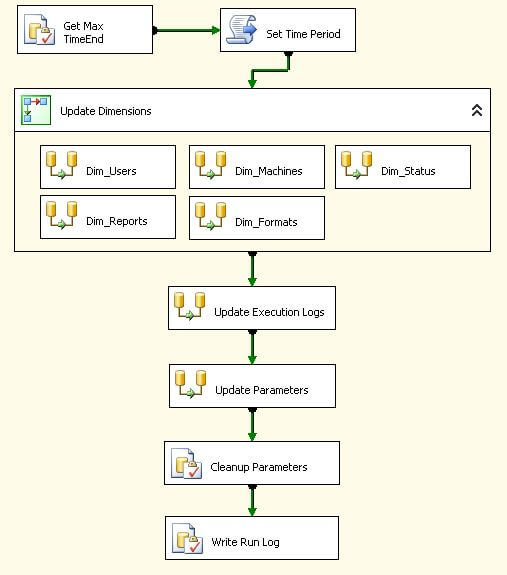
The following are the main points about the SSIS package control flow:
- Get Max TimeEnd executes a query to retrieve the maximum report ending time in the data mart; this is used to extract data for reports that have ended since the last time the package was run.
- Set Time Period formulates some queries based on the Max TimeEnd
- Update Dimensions contains data flows to extract and populate the various dimensions
- Update Execution Logs extracts and populates the ExecutionLogs fact table
- Update Parameters extracts and populates the ExecutionParameters dimension which shows the parameters used when a report is run
- Cleanup Parameters sets the Parameters column in the ExecutionLogs table to NULL (since the parameters have been populated in the ExecutionParameters dimension)
- Write Run Log inserts rows into the RunLogs table detailing activity performed during execution of the package
Running the Reports
Now let's review some sample report from the Execution Summary SSRS Report. The report is shown below in multiple screen shots just for convenience of copying and pasting. The first section shows report executions per day of the month and per week:
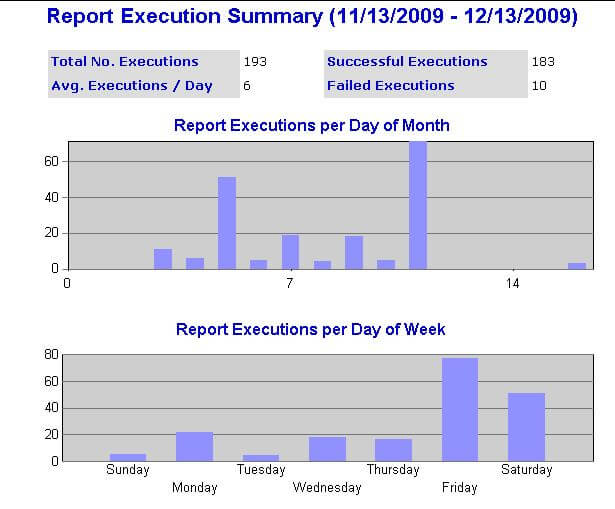
You may recognize the pattern in the Report Executions per Day of Week chart above. I worked on a project where the sales numbers and commissions for the previous week became available on Friday morning. There is a definite spike in report usage on Fridays and Saturdays. Since this data doesn't change after it's computed, it's an excellent candidate for a report snapshot where you run the report during off hours, a snapshot is created, then users get the results from the snapshot instead of retrieving the data from the database each time the report is run. The snapshot typically provides a nice performance boost where the data changes happen at predictable times.
The second section of the report shows the top ten lists for most executed, longest running, largest, and users:
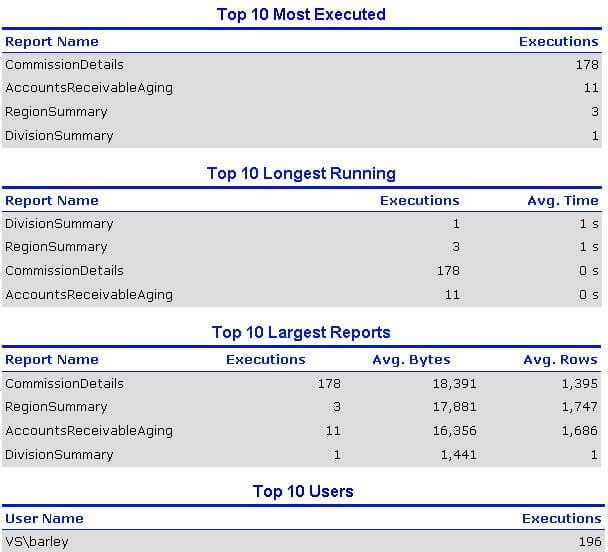
Finally the Report Name column above is a hyperlink to the Report Summary which provides details on the execution of a single report, including the parameters used by the report.
Next Steps
- Take a close look at the Execution Log Sample Reports and SSIS package as they provide an excellent starting point for getting a handle on who's running reports, when are they running them, how much data is retrieved, and how long does it take to run the report.
- To the extent that you are experiencing performance problems and you can identify specific reports as the culprits, you can use the sample reports to come up with various strategies to mitigate your performance problems. Typical strategies include scheduling reports to run in off hours, using data-driven subscriptions to deliver reports to users, creating report snapshots, and taking advantage of report caching.
- After creating the data mart and updating it by running the SSIS package, you now have the capability to run ad-hoc queries to perform additional analysis on report executions.


About the author
 Ray Barley is a Principal Architect at IT Resource Partners and a MSSQLTips.com BI Expert.
This author pledges the content of this article is based on professional experience and not AI generated.
View all my tips
