Problem
Many times we need to find important events that occurred on the SQL Server database server, but we may not always have a process in place to capture this data. In this tip we look at some quick methods to view events that occurred in SQL Server like Shrink, AutoGrow, Automatic Update Statistics, Backup/Restore, DBCC, Missing Column Statistics, and more using the Default Trace.
Solution
SQL Server provides a Default Trace of 34 selected events that can be accessed via tools like SQL Profiler or directly via T-SQL. The SQL Server Default Trace is enabled by default.
We will query the Default Trace to get details of the events described in the problem statement including Shrink, AutoGrow, Automatic Update Statistics, Backup/Restore, DBCC, Missing Column Statistics, and more. An important point to know is that when a trace is configured to capture just a few events, it runs in the background and has little impact on the general performance of the database server. However, collecting a lot of events and viewing traces in real time via the GUI may cause some server performance degradation, so when you need to run a trace via SQL Profiler you should keep in mind the potential performance hit and capture only required events (and use filters too to limit the events that are returned).
Note: You should run these queries from the master database and also note that the queries only return data from the current Default Trace File. The queries below pull the path for the current Trace, so if you want to look at older files you can just hard code the path to the file you want to query.
SQL Server Default Trace Details
Normally in SQL Server we will see just the Default Trace running, but there some environments where we will have more than one trace. We can see traces that are running or created on the server using this T-SQL code:
-- List all traces in the server
SELECT * FROM sys.traces
The Default Trace usualy has an ID equal to 1, but it may not always, so if we want to know exactly what is the Default Trace then we can use this query:
SELECT * FROM sys.traces WHERE is_default = 1
As I have said above, the Default Trace captures details of 34 events (and you can add more events) and we can check the complete list using this T-SQL code:
DECLARE @id INT
SELECT @id=id FROM sys.traces WHERE is_default = 1
SELECT DISTINCT eventid, name
FROM  fn_trace_geteventinfo(@id) EI
JOIN sys.trace_events TE
ON EI.eventid = TE.trace_event_id
Here is a partial result set:

Find Captured Trace Events and Occurrence
For example the following is a very useful query to get the events that have been captured and their occurrence:
DECLARE @path NVARCHAR(260)
SELECT @path=path FROM sys.traces WHERE is_default = 1
SELECT TE.name AS EventName, DT.DatabaseName, DT.ApplicationName,
DT.LoginName, COUNT(*) AS Quantity
FROM dbo.fn_trace_gettable (@path,  DEFAULT) DT
INNER JOIN sys.trace_events TE
ON DT.EventClass = TE.trace_event_id
GROUP BY TE.name , DT.DatabaseName , DT.ApplicationName, DT.LoginName
ORDER BY TE.name, DT.DatabaseName , DT.ApplicationName, DT.LoginName

SQL Server Auto Grow Information
We can filter the information of each event by using the EventClass as I have used in each of the queries below. Now its time to see some of the examples to check details of some of the important events.
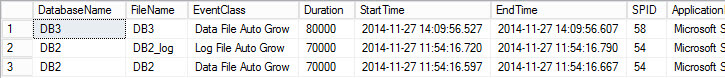
One of the most important events that we would like to check is Data and Log File Auto Grow, so that we can analyze and make some decisions.
DECLARE @path NVARCHAR(260)
SELECT @path=path FROM sys.traces WHERE is_default = 1
--Database: Data & Log File Auto Grow
SELECT DatabaseName, [FileName],
CASE EventClass WHEN 92 THEN 'Data File Auto Grow'
 WHEN 93 THEN 'Log File Auto Grow'END AS EventClass,
Duration, StartTime, EndTime, SPID, ApplicationName, LoginName
FROM sys.fn_trace_gettable(@path, DEFAULT)
WHERE EventClass IN (92,93)
ORDER BY StartTime DESC
SQL Server Data and Log File Shrinks
With this query we can get details of Data and Log File Shrink events.
DECLARE @path NVARCHAR(260)
SELECT @path=path FROM sys.traces WHERE is_default = 1
--Database: Data & Log File Shrink
SELECT TextData, Duration, StartTime, EndTime, SPID, ApplicationName, LoginName
FROM sys.fn_trace_gettable(@path, DEFAULT)
WHERE EventClass IN (116) AND TextData like 'DBCC%SHRINK%'
ORDER BY StartTime DESC

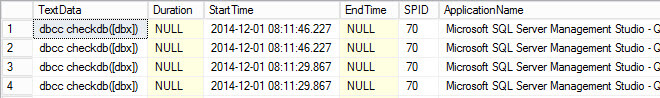
Finding When SQL Server DBCC Commands Were Run
Checking into DBCC CHECKDB, DBCC CHECKTABLE, DBCC CHECKCATALOG, DBCC CHECKALLOC, DBCC CHECKFILEGROUP events, and more…
DECLARE @path NVARCHAR(260)
SELECT @path=path FROM sys.traces WHERE is_default = 1
--Security Audit: Audit DBCC CHECKDB, DBCC CHECKTABLE, DBCC CHECKCATALOG,
--DBCC CHECKALLOC, DBCC CHECKFILEGROUP Events, and more.
SELECT TextData, Duration, StartTime, EndTime, SPID, ApplicationName, LoginName
FROM sys.fn_trace_gettable(@path, DEFAULT)
WHERE EventClass IN (116) AND TextData like 'DBCC%CHECK%'
ORDER BY StartTime DESC
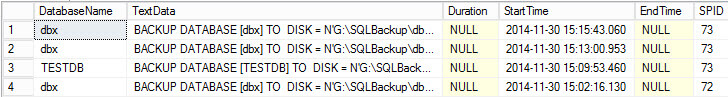
When SQL Server Backups Occurred
Now we can check details of the Backup Event (more detailed info about backup task can be obtained by querying dbo.backupset table from msdb database):
DECLARE @path NVARCHAR(260)
SELECT @path=path FROM sys.traces WHERE is_default = 1
--Security Audit: Audit Backup Event
SELECT DatabaseName, TextData, Duration, StartTime, EndTime,
SPID, ApplicationName, LoginName
FROM sys.fn_trace_gettable(@path, DEFAULT)
WHERE EventClass IN (115) and EventSubClass=1
ORDER BY StartTime DESC
When SQL Server Restores Occurred
Checking details of Restore Event (more detailed info about restore tasks can be obtained by querying some tables like restore history, restorefile and restorefilegroup from msdb database):
DECLARE @path NVARCHAR(260)
SELECT @path=path FROM sys.traces WHERE is_default = 1
--Security Audit: Audit Restore Event
SELECT TextData, Duration, StartTime, EndTime, SPID, ApplicationName, LoginName
 FROM sys.fn_trace_gettable(@path, DEFAULT)
WHERE EventClass IN (115) and EventSubClass=2
ORDER BY StartTime DESC

Find SQL Server Errors for Hash Warnings
Checking event details of Errors and Warnings: Hash Warning.
DECLARE @path NVARCHAR(260)
SELECT @path=path FROM sys.traces WHERE is_default = 1
--Errors and Warnings: Hash Warning
SELECT TextData, Duration, StartTime, EndTime, SPID, ApplicationName, LoginName
FROM sys.fn_trace_gettable(@path, DEFAULT)
WHERE EventClass IN (55)
ORDER BY StartTime DESC
Find SQL Server Errors for Missing Column Statistics
Checking event details of Errors and Warnings: Missing Column Statistics.
DECLARE @path NVARCHAR(260)
SELECT @path=path FROM sys.traces WHERE is_default = 1
--Errors and Warnings: Missing Column Statistics
SELECT DatabaseName, TextData, Duration, StartTime, EndTime, SPID, ApplicationName, LoginName
FROM sys.fn_trace_gettable(@path, DEFAULT)
WHERE  EventClass IN (79)
ORDER BY StartTime DESC;
Find SQL Server Errors for Missing Join Predicates
Checking event details of Errors and Warnings: Missing Join Predicate.
DECLARE @path NVARCHAR(260)
SELECT @path=path FROM sys.traces WHERE is_default = 1
--Errors and Warnings: Missing Join Predicate
SELECT DatabaseName,TextData, Duration, StartTime, EndTime, SPID, ApplicationName, LoginName
FROM sys.fn_trace_gettable(@path, DEFAULT)
WHERE EventClass IN (80)
ORDER BY  StartTime DESC
Find SQL Server Errors for Sort Warnings
Checking event details of Errors and Warnings: Sort Warnings.
DECLARE @path NVARCHAR(260)
SELECT @path=path FROM sys.traces WHERE is_default = 1
--Errors and Warnings: Sort Warnings
SELECT DatabaseName, TextData, Duration, StartTime, EndTime,
SPID, ApplicationName, LoginName
FROM sys.fn_trace_gettable(@path, DEFAULT)
WHERE EventClass IN (69)
ORDER BY StartTime DESC
Find SQL Server Errors for the ErrorLog
We know that we can read more details directly from the SQL Server Error Log, but some events can also be queried from the Default Trace. Checking event details of Errors and Warnings: ErrorLog.
DECLARE @path NVARCHAR(260)
SELECT @path=path FROM sys.traces WHERE is_default = 1
--Errors and Warnings: ErrorLog
SELECT TextData, Duration, StartTime, EndTime, SPID, ApplicationName, LoginName
FROM sys.fn_trace_gettable(@path, DEFAULT)
WHERE EventClass IN (22)
ORDER BY StartTime DESC
Adding and Finding SQL Server Auto Statistics Events
The Default trace does not include information on Auto Statistics event, but you can add this event to be captured by using the sp_trace_setevent stored procedure. The trace event id is 58. It important to say that the information for this event can also be queried from the sys.dm_db_stats_properties DMF or Extended Events. Checking event details of Auto Statistics indicates automatic updating of index statistics that have occurred.
DECLARE @path NVARCHAR(260)
SELECT @path=path FROM sys.traces WHERE is_default = 1
--Auto Stats, Indicates an automatic updating of index statistics has occurred.
SELECT TextData, ObjectID, ObjectName, IndexID, Duration, StartTime, EndTime,
SPID, ApplicationName, LoginName
FROM sys.fn_trace_gettable(@path, DEFAULT)
WHERE EventClass IN (58)
ORDER BY StartTime DESC
Next Steps
- As you can see these quick queries can be extremely useful to check details of several important events for auditing purposes. Test them out in your environment.
- Read these additional related tips:
