Problem
I have heard of the default trace in SQL Server. I know it’s on by default, but I don’t know how to use it. What can I do with the default trace?
Solution
The default trace is a feature first included with SQL Server 2005 which provides auditing on schema modifications such as table creation and stored procedure deletion and the like. It does run by default, but you can turn it on and off using sp_configure as detailed in a previous tip.
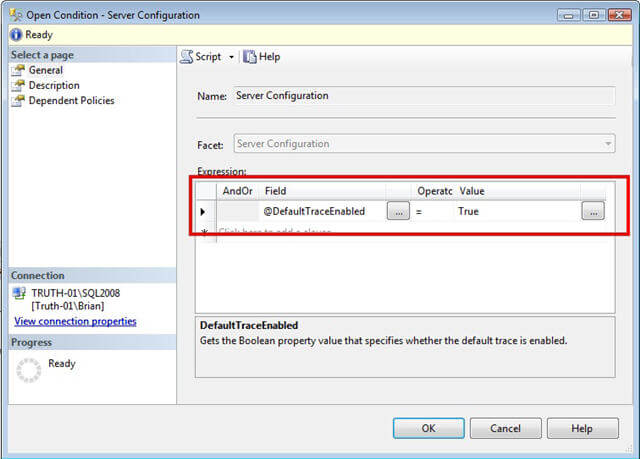
If you are using SQL Server 2008 or later, you can enforce whether it is on or off using Policy Management. The server configuration facet has a parameter called @DefaultTraceEnabled which corresponds to turning on or off the default trace. For instance, here is a Policy Management Condition which enforces the default trace being on:
Using the Schema Changes History Report
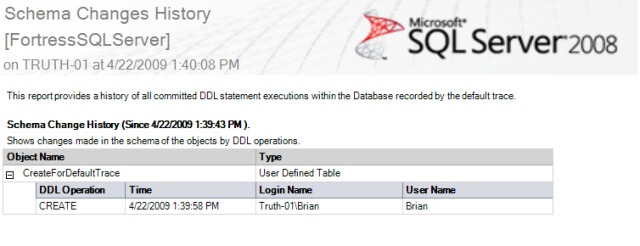
If you have the default trace running, you are able to easily bring up DDL changes both at a database or a server level by looking at the Schema Changes History report. You can get to this report at the database level by right-clicking on the database, choosing Reports, then choosing Standard Reports, and finally selecting Schema Changes History.

If you want to see all the changes at the server level, you would simply right-click on the server and begin the navigation. An example of the report is shown below. Note that who made the change and when it was made is captured.
Using SQL Profiler
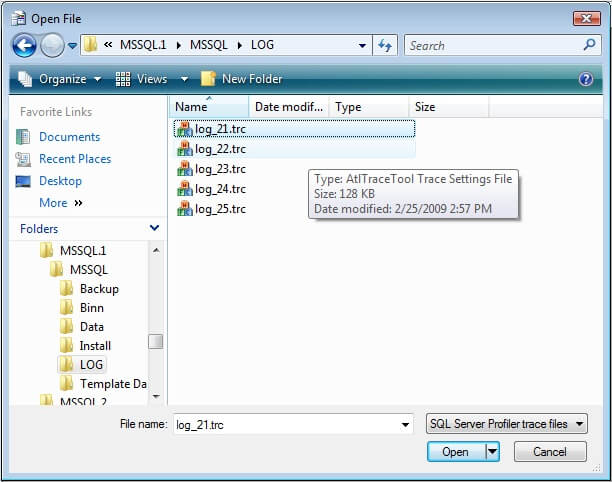
Another way of using the default trace is via SQL Server Profiler. The files for the default trace are stored in the default LOG directory for your particular SQL Server. You’ll be looking for the smallest numbered log file:
You’ll be prompted for file rollover for each additional trace file. The prompt should look something like this:

You’ll want to select Yes for each time you are prompted. This will allow Profiler to show the complete contents stored in the default trace file. Once you’ve done so, you can examine the trace, just as you would any other. There’s a lot of information stored in the trace, so I’ve taken a snapshot and highlighted the CREATE TABLE we saw in the Schema Changes History report:
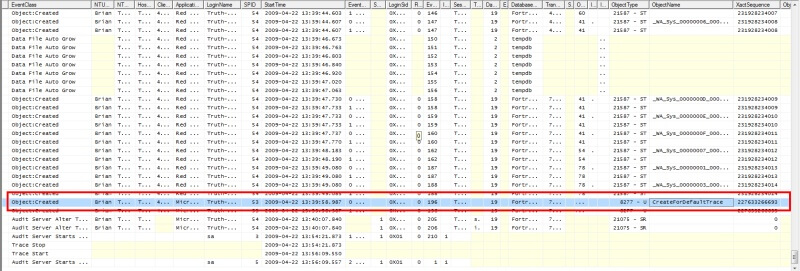
Keep in mind that when viewing the default trace information in this way, that the default trace file will contain information for the entire server. Therefore, keying in on the database name is important. Also, at a casual glance of the screenshot, you can see that more than just the table reported by the Schema Changes History report is captured in the trace file. For instance, the database autogrowth of tempdb can be seen as well as creation of some statistics within the FortressSQLServer database can be seen.
Using T-SQL
The default trace should be the first numbered trace running on your SQL Server. However, you can verify by looking at the value corresponding to the trace file location. This simple query will return that information for all traces running on the system. You’re looking for a location that matches your default LOG folder.
SELECT traceid, value
FROM [fn_trace_getinfo](NULL)
WHERE [property] = 2
Once you have the traceID, you can then query the default trace file using the fn_trace_gettable() function. One catch if you use the fn_trace_getinfo() function to determine that the default trace is running: it will return the most current trace file that is open. When I ran it, I got a value that ended in log_131.trc. However, the starting trace file was log_127.trc. I had to look in the directory to determine the correct file to start from. Once you have that, you can display the results as a resultset using the following query (substitute the starting trace file accordingly):
SELECT *
FROM [fn_trace_gettable]('C:\Program Files\Microsoft SQL Server\MSSQL.2\MSSQL\LOG\log_127.trc', DEFAULT)
ORDER BY StartTime
I’ve ordered it by StartTime, just to get a reasonable order. However, you could also use a SELECT INTO and an IDENTITY() column if you need the order perfectly maintained.
Next Steps
- I have shown you how you can pull information that SQL Server is already gathering using the default trace. Next time you need to find some information see if the default trace has already captured the data before starting a new trace

Brian Kelley is an author, columnist, Certified Information Systems Auditor (CISA), and former Microsoft Data Platform (SQL Server) MVP (2009-2016) focusing primarily on SQL Server and Windows security. Brian currently serves as a data architect as well as an independent infrastructure/security architect concentrating on Active Directory, SQL Server, and Windows Server. He has served in a myriad of other positions including senior database administrator, data warehouse architect, web developer, incident response team lead, and project manager. Brian has spoken at 24 Hours of PASS, IT/Dev Connections, SQLConnections, the Techno Security and Forensics Investigation Conference, the IT GRC Forum, SyntaxCon, and at various SQL Saturdays, Code Camps, and user groups.
- MSSQLTips Awards: Author of the Year Contender – 2015, 2017 | Champion (100+ tips) – 2014