By: Ben Snaidero | Comments (4) | Related: > Profiler and Trace
Problem
Every DBA faces the issue of long running SQL Server queries running against their database systems. Ideally any long running queries would be identified and fixed during the development process, but as we all know this isn't always the case. Whether some new T-SQL slips through without being thoroughly tested or data differences between your development/testing and your production environment cause you to have a long running query executing in production or simply someone trying to troubleshoot a production issue executes an ad-hoc query that runs forever. Whatever the reason, we as DBAs need a way to identify these long running transactions. The following tip will provide one method you can use to identify any long running queries executing in your environment.
Solution
If you've read any of my other tips or my tutorial you'd notice that I am a big fan of using the SQL Profiler tool to identify or measure query performance. This tip will go through an example and show how we can use this tool to identify any long running queries that are running against your SQL Server database instance.
Test Setup
In order to demonstrate how to capture a long running query in your database instance we will create a couple simple stored procedures. One will simply have a call to the WAITFOR DELAY command, this will be our slow query and a second that will call this stored procedure. We have this second stored procedure so that we can show how to drill down within a stored procedure in SQL Profiler as in many cases there could be many different statements in a stored procedure and it is usually just one that causes the slowness. Below is the T-SQL to create these two stored procedures.
-- create test stored procedures
CREATE PROCEDURE spTestSubProcedure
AS
BEGIN
 WAITFOR DELAY '00:00:15'
END
GO
CREATE PROCEDURE spTestProcedure
AS
BEGIN
 SELECT getdate()
 EXEC spTestSubProcedure
 SELECT getdate()
END
GO
SQL Profiler Session Setup
For details on launching SQL Profiler and for more details on completing the General tab of the Trace Properties screen please refer to my tutorial. For this example we will strictly concentrate on configuring the "Events Selection" tab of this screen including setting the appropriate filter in order to capture any long running queries.
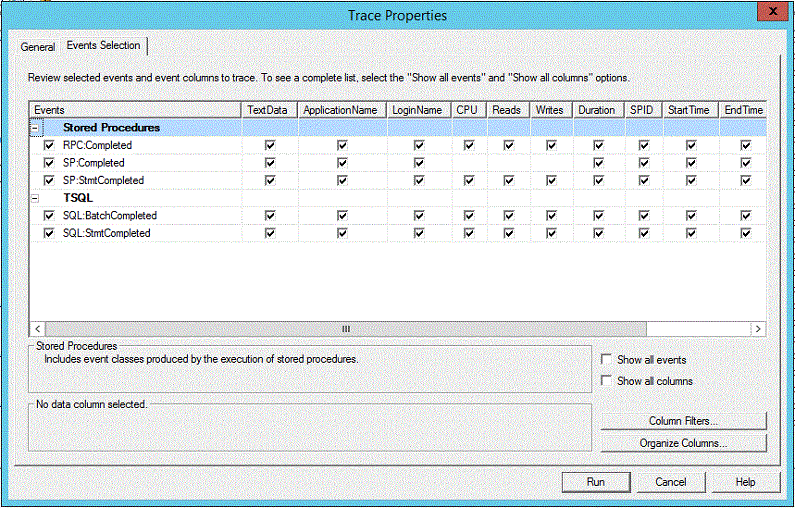
There are a few different events that are needed in order to capture all the SQL statements that could be executed against your SQL Server instance. First there are batch commands which are captured by including the SQL: BatchCompleted event in your trace. The other events are stored procedure calls which can also be captured with the previous event depending on how they are called, but to ensure they are captured we will include the RPC: Completed and SP: Completed events. A good description of the differences between the types of calls to our database can be found here. This is an older article, but the descriptions are still relevant.
It's also a good idea to include the SP: StmtCompleted event in your trace as in a lot of cases it's a single statement in your stored procedure that will cause the slowness and this event will allow you to capture that detail.
With all the events above you can also include the corresponding "Starting" event to capture when a statement is started. This can come in handy when a statement takes a really long time to complete. If you run your SQL trace session for a fixed amount of time a query could technically not finish during your trace session so you would not capture the "Completed" event. Below is a screenshot showing the "Events Selection" tab with the "*:Completed" events mentioned above.

One other thing to note on the "Events Selection" tab above is you can also add some columns to help you find what application/user is executing the query. I usually just have LoginName as shown above as that is usually enough, but you could also add things like HostName or clientprocessid to help you track down the application/user.
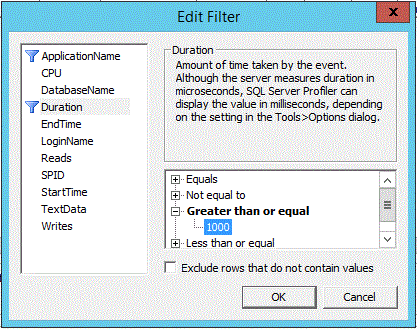
Next we need to configure our statement filter since we don't want to collect every statement executed against our SQL Server instance, only the slow queries. Defining what a slow query is will depend on your application and the SLAs defined for it, but in most cases for the applications I have dealt with something around 1 second is a good starting point. Remember that SQL Profiler uses milliseconds so when setting the filter to find queries taking longer than 1 second to execute we will have to enter 1000. Below is a screenshot of this configuration.

SQL Profiler Session Example
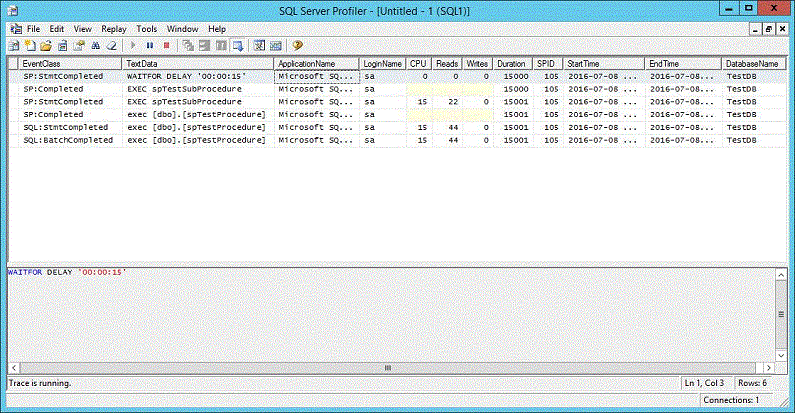
Now that we have our SQL Profiler session configured we can start it and execute the stored procedure we created during the test setup, spTestProcedure, using SSMS. After executing the stored procedure you should see the following in your SQL Profiler output window.

Notice in this output window we can see the cascading call to the stored procedure that is called from the main stored procedure. Since we also have the SP: StmtCompleted event we can also see that it's the "WAITFOR" statement within this stored procedure that is causing the slowness. This is a really simple example, but it shows how with just a few events and a single filter you can use SQL Profiler to find long running queries in your SQL Server instance.
Next Steps
- Read my tutorial on using SQL Server Profiler
- Read other tips on SQL Profiler
- Read other tips on performance tuning
About the author
 Ben Snaidero has been a SQL Server and Oracle DBA for over 10 years and focuses on performance tuning.
This author pledges the content of this article is based on professional experience and not AI generated.
View all my tips


