By: John Sterrett | Comments | Related: > Profiler and Trace
Problem
You're starting to work with or troubleshoot an application that doesn't have documentation. You need to find all the database calls from the application to the database during the execution of a feature within the application. You know Profiler will help trace transactions, but you see so many transactions your head spins. You need to only trace the transactions created by you during testing. In this tip I walk through how to setup filtering to minimize the amount of transactions that are captured.
Solution
SQL Server provides a free tool to help you trace the ongoing transactions. This tool is SQL Server Profiler. We will walk you through the steps to use Profiler to trace an application's database calls.
In this example we will be using SQL Server Management Studio (SSMS) as our application and run two basic queries against the AdventureWorks database, to see how these are captured. In practice, you will usually be executing an event handler (clicking on a button) in a third-party application or a custom built application.
Loading Profiler
With SQL Server 2005 and 2008 you can load profiler in a few ways. Below are two examples.
- Click on the start menu and follow the following path. Start | SQL Server 2005 | Performance Tools | SQL Server Profiler

- You can also load Profiler from SSMS. This is done by clicking on the "Tools" menu and selecting "SQL Server Profiler" from the dropdown.
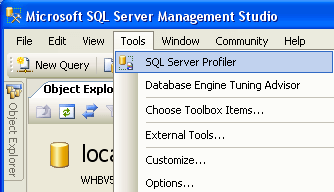
Running a New Trace
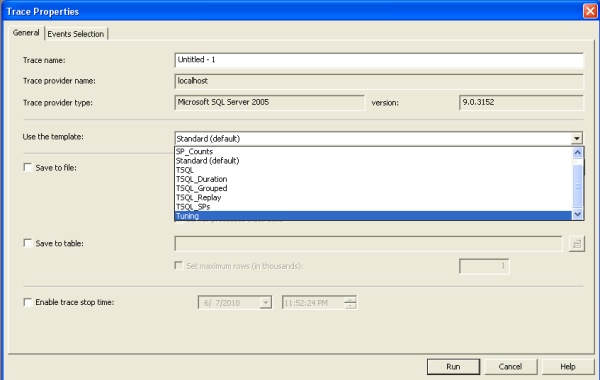
Now that you have Profiler open you need to create a new trace. This is done by clicking on the file menu and selecting a new trace. Connect to the instance you would like to trace using Windows or SQL Authentication. Profiler comes preloaded with about a half dozen templates. For this example we are going to select the Tuning template. For more information about the preloaded templates check out books online.
Once you have the tuning template selected, select the "Events Selection" tab and notice the following default columns and events shown in the image below. There are only three events selected RPC:Completed, SP:StmtCompleted and SQL:BatchCompleted. This alone will filter out a lot of unwanted events you would normally see if you used the default trace. For example, Audit Logins are not shown when the trace starts.
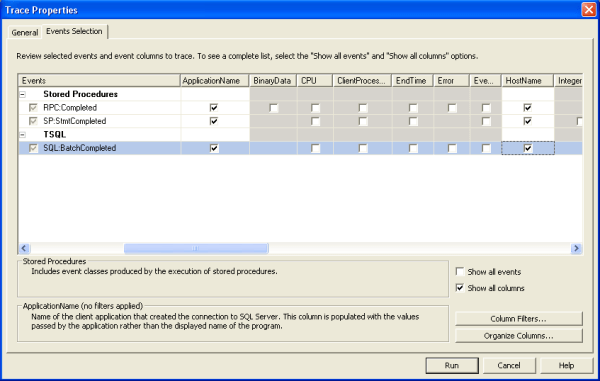
Next we will add some additional columns that will help filter transactions created by other applications and users. Remember we only want to see transactions for a particular part of an application executed by you. Therefore, we will add the following columns and use them during the filtering process in the next step.
|
Helpful Columns for Filtering Profiler |
| ApplicationName - Name of the client application that created the connection. |
| HostName - Name of the computer where the query is running. |
| LoginName - Name of the login of the user (either SQL Security login or Windows Login credentials in DOMAIN\Username.) This can be very helpful if your application used windows authentication. |
| DatabaseName - The name of the Database in which the statement of the user is running. In some cases you may need to use the DatabaseID. |
Click on the "Column Filters..." checkbox in the bottom right corner of the screen. This will allow us to filter out transaction using like and not like statements. We will start the filtering to only show transactions coming from SSMS by you. Notice below that we are able to use wildcards in our like statement. To determine the ApplicationName, HostName, LoginName and DatabaseName you can use Activity Monitor in SSMS, query the sys.sysprocesses table or execute sp_who2. For the example below we are using "%SQL%" this is because SQL Server Management Studio actually shows up as "Microsoft SQL Server Management Studio", so the % on both sides will allow us to capture anything with "SQL" in the ApplicationName.
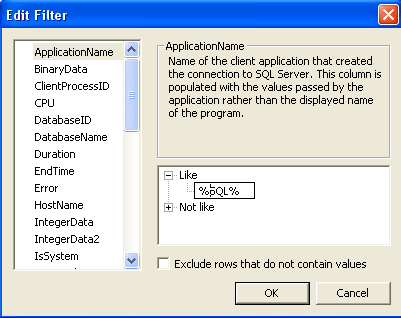
Once you have added all the filters needed click on the OK button to save the filters. Next click on the Run button. This will start the Profiler trace and you should notice that you don't see any transactions being captured.
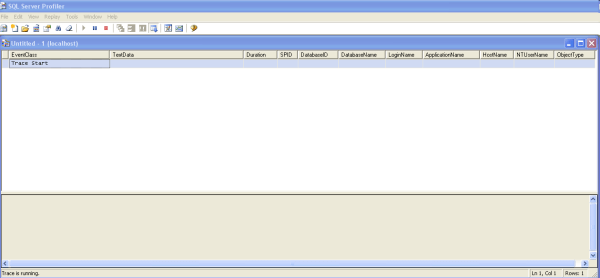
Testing Profiler Filter
Let's fire off some queries from Management Studio (SSMS) to show that Profiler is filtered to only show queries we are executing via SSMS. Remember in practice you will be using an application and running through features to capture all the SQL calls made.
Below are two queries we will use to test our filter.
SELECT TOP 100 *
FROM HumanResources.Employee
SELECT TOP 100 *
FROM Production.Product
GO
You should see the following two entries being captured.
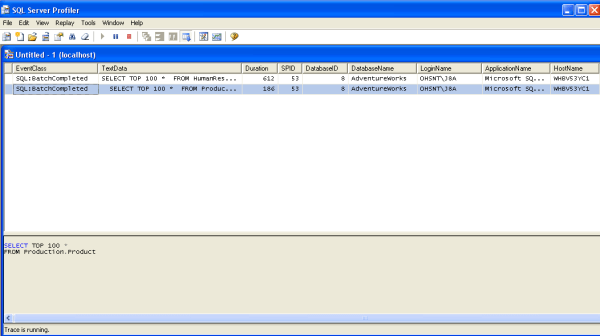
Finally, you can see all the queries that were fired due to the event that occurred in your application (two queries we executed above). Once again, this is where we would document our findings (the queries) and then click on the eraser icon to clear the trace. This will allow you to move on to document the queries fired for the next event in your application.
Next Steps
- Auto Generate an Hourly SQL Server Profiler Trace File
- Creating a Trace Template in SQL Server Profiler
- Scheduling a SQL Server Profiler Trace
- SQL Server Performance Statistics Using a Server Side Trace
- Books Online - Profiler Templates
About the author
 John Sterrett is a DBA and Software Developer with expertise in data modeling, database design, administration and development.
This author pledges the content of this article is based on professional experience and not AI generated.
View all my tips


