Problem
Power BI Desktop is Microsoft’s platform for analytics and visualization. The product has been around for over ten years, making it a mature feature-rich choice for business intelligence reporting and actionable insights. How do you get started downloading, installing, and configuring Power BI desktop?
Solution
Getting started with Microsoft Power BI Desktop is straightforward and comes in two flavors: getting the app from the Microsoft Windows Store or downloading the Windows installer. Once installed, you are ready to connect to data sources and begin transforming, modeling, and visualizing your data.
In addition, we will walk through how to build a report using the AdventureWorks sample database.
Why Power BI?
Power BI is a powerful platform designed for analytics and visualization. The advanced set of features suits a wide range of users: from business power users to DBA’s, developers, BI engineers, and analytics specialists. Power BI Desktop, which is the focus of this document, offers three core functionalities that make it stand out:
- Multiple data connectors: flat files, databases, cloud services, on-prem and cloud data warehouse and much more.
- Data modeling and transformation: prepare and shape your data using Power Query.
- Data visualization: use a rich set of visuals to expose the value of your data.
Get Power BI Desktop from the Windows Store
The first option to get Power BI Desktop is to install the app from the Windows Store, which will guarantee you automatic updates. From the Start Menu, find the Microsoft store and search for “Power BI”:

Click on Power BI Desktop, then click “Get”:

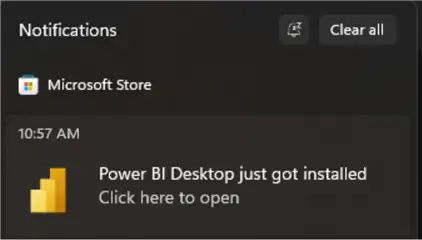
After a short while, you will get a notification of the app installed:
You will then be able to open the app back from the Windows store or from the start menu.
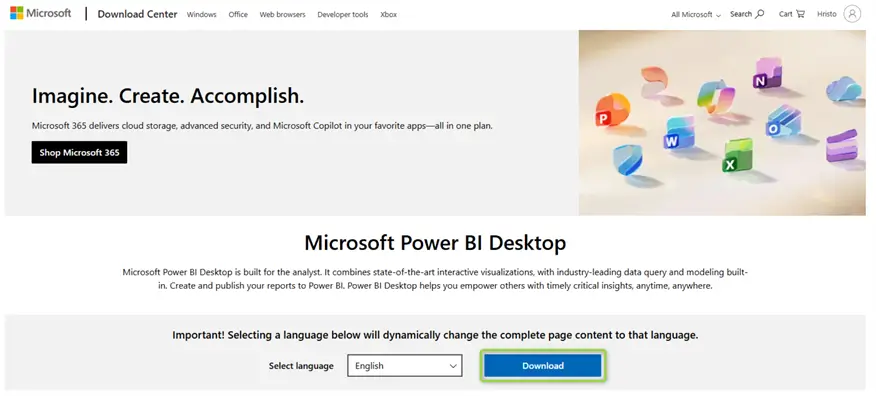
Download Power BI Desktop Installer
If you want to have full control over the installation but with manual updates subsequently, go the Power BI Desktop download page:
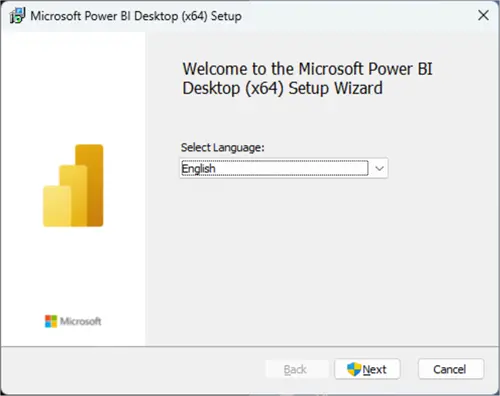
Once the installer downloads, double-click to open it and get started with the installation:
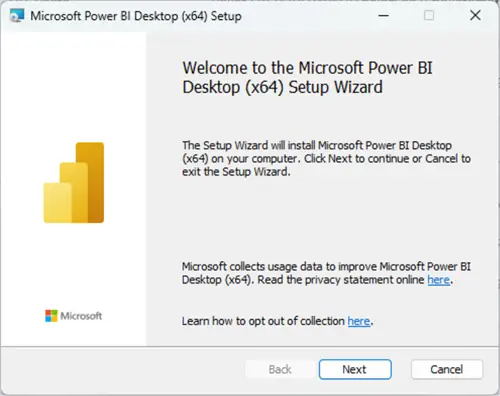
Click Next to move to the next step:
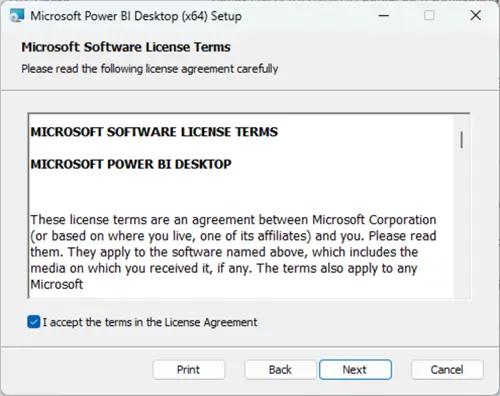
Accept the terms:
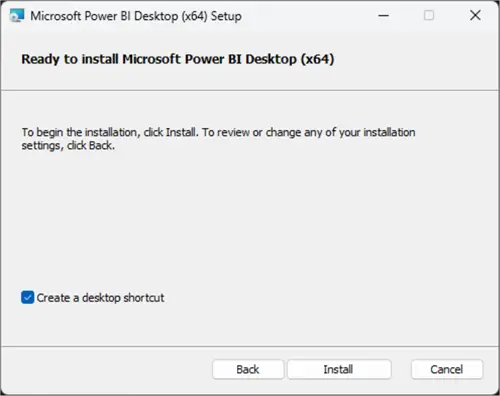
Finally check Create a desktop shortcut and click Install:
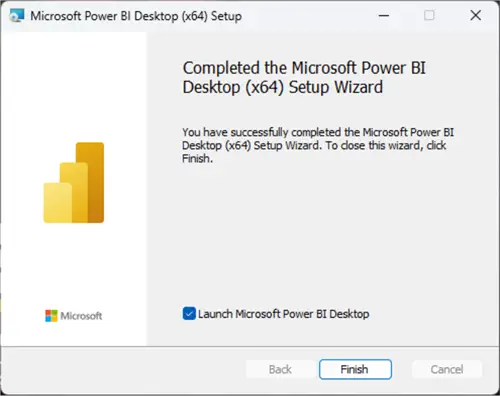
The installation process will take a while depending on your system. Then you will be able to launch Power BI Desktop.
Your First Power BI Report
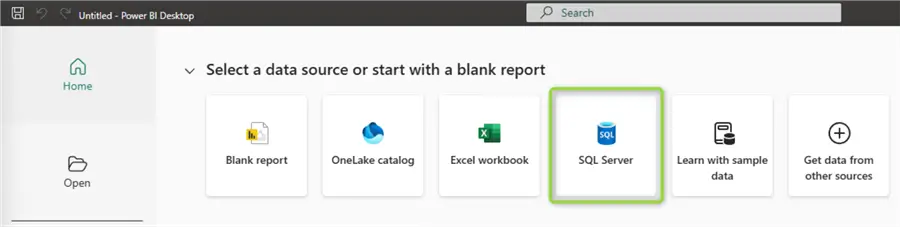
Now that you have Power BI Desktop installed, open the application either from the Windows store or using the desktop icon. You will then see the Power BI Desktop home page. From this home page, you can open an existing report or create a new one.

To demonstrate a full cycle of analytics operations, we will first connect to a data source, then model and transform the data, and finally create a couple of charts.
Connect to a Data Source
Let us connect to an Azure SQL Database Server to pull data for our report:
You will be prompted to provide server address, and optionally database name and SQL statement. We will use the AdventurWorks2022 sample database that I already have deployed to Azure:

Note the Data Connectivity mode: select Import to bring the data to the Power BI data model. On the other hand, Direct Query mode establishes a direct data connection, does not import data and you cannot apply transformations using the Power BI engine. Some of the fine nuances between using the two modes are listed here.
Next, click OK to trigger the authentication pop-up. I will use the Microsoft account option to sign in because I have added my Entra ID account to the database:
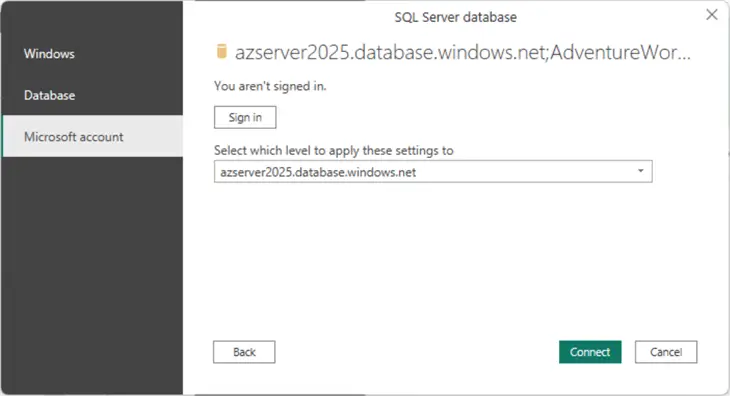
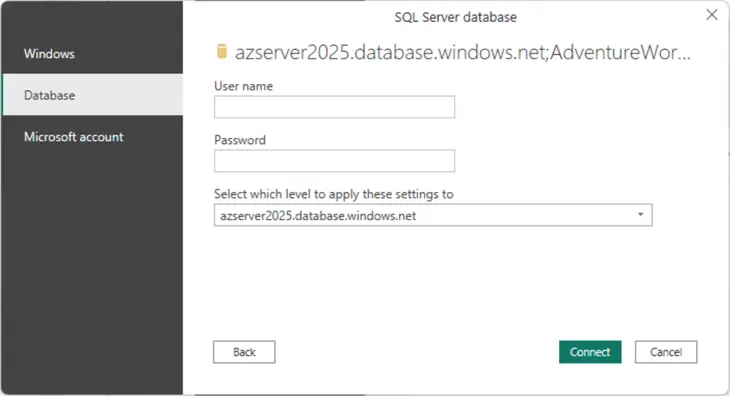
Alternatively, you can use database-only credentials to log in:
When authenticated successfully, you see the Navigator window pop up. Select the tables and views you are interested in and click Load:
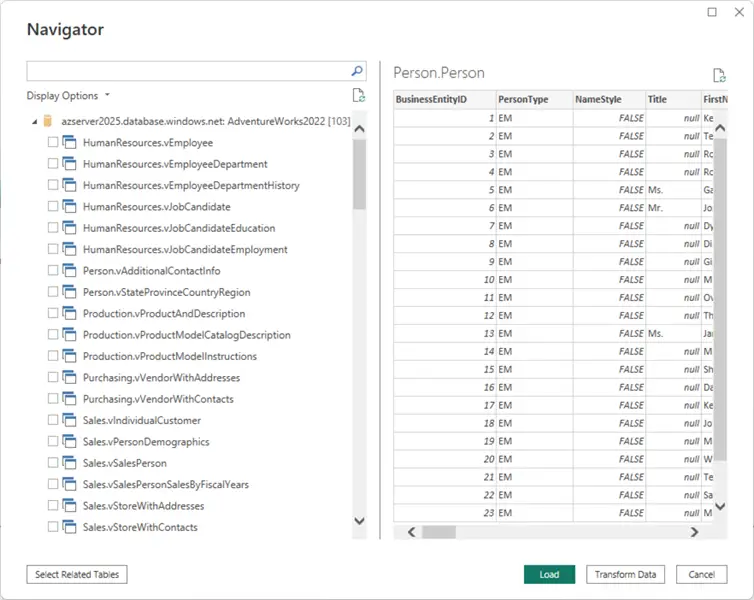
I am interested in the following tables. Importing them will enable me to report on sales by salesperson by year and territory:
- [Sales].[SalesPerson]
- [Sales].[SalesOrderHeader]
- [Sales].[SalesTerritory]
- [HumanResources].[Employee]
- [Person].[Person]
Model Data
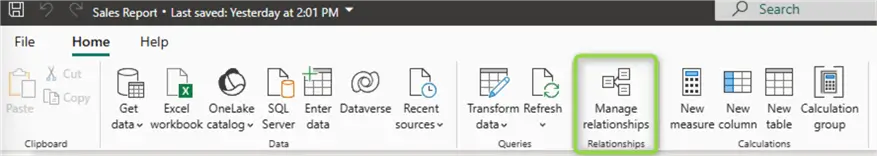
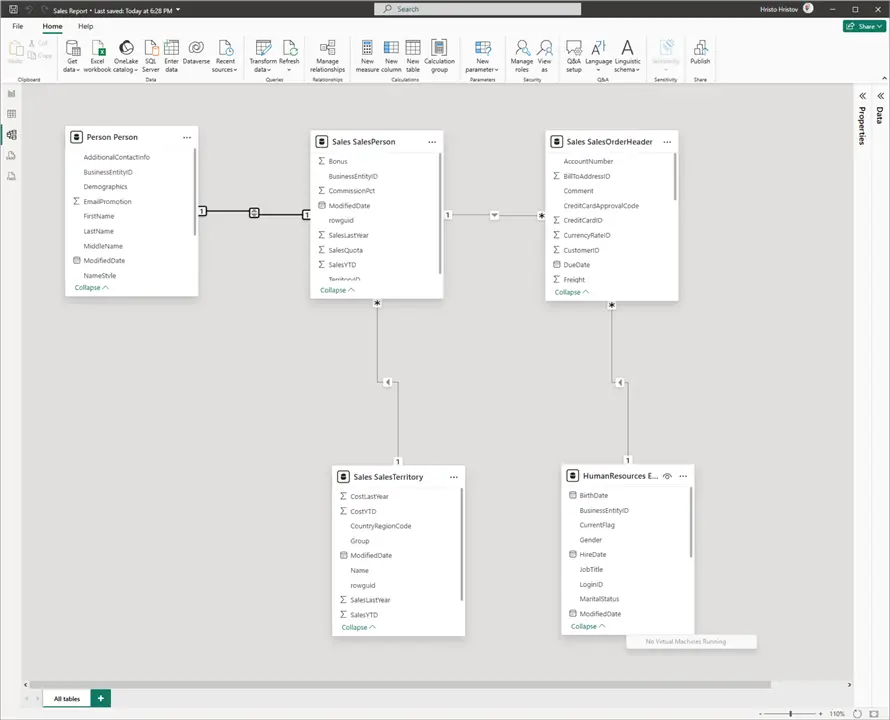
Having the tables imported in Power BI Desktop we can head over to the Model View (third icon from the top in the left navigation pane) to examine the relationships. Power BI will automatically recognize or create relationships based on the table schemas:
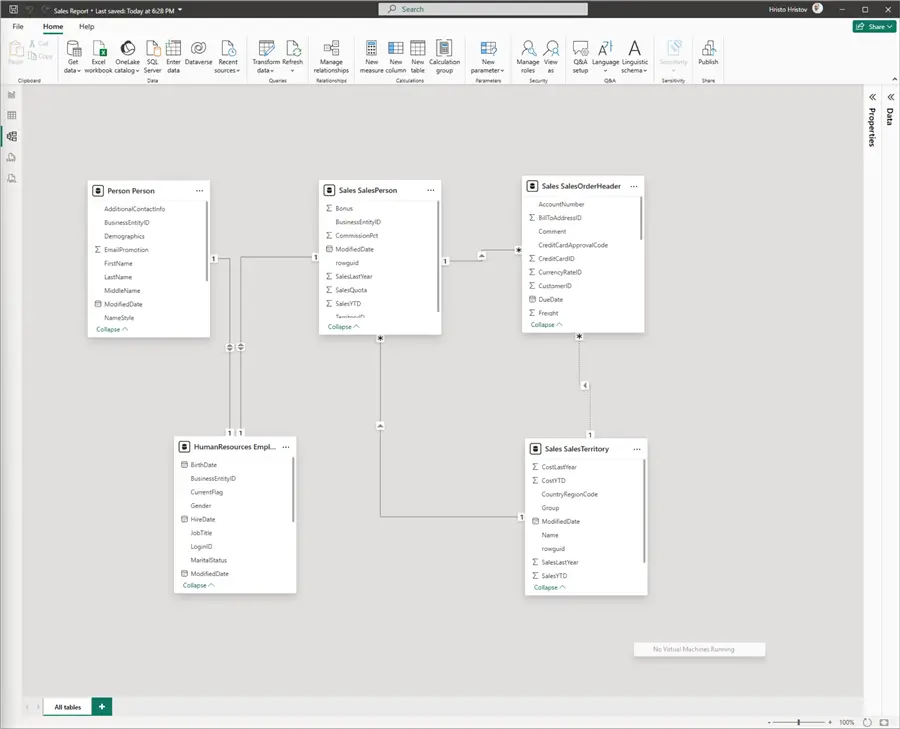
However, for our report, we need to modify these relationships. In other words, we must model the data to suit the reporting purpose. To modify a relationship, we can double-click on the line connecting the two tables. We need to do this for all relationships; therefore, it is more practical to use the Manage Relationships window which will provide a complete overview:
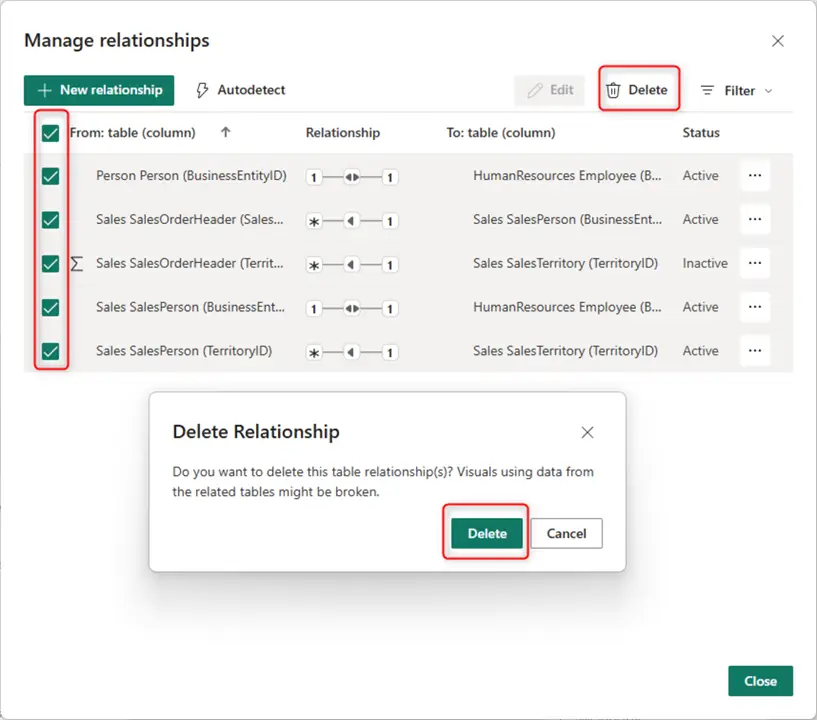
First let us delete all existing relationships:
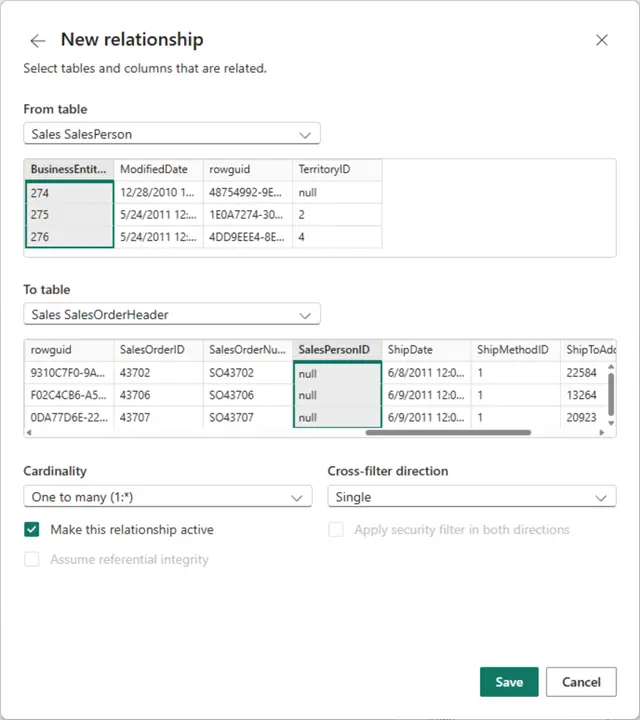
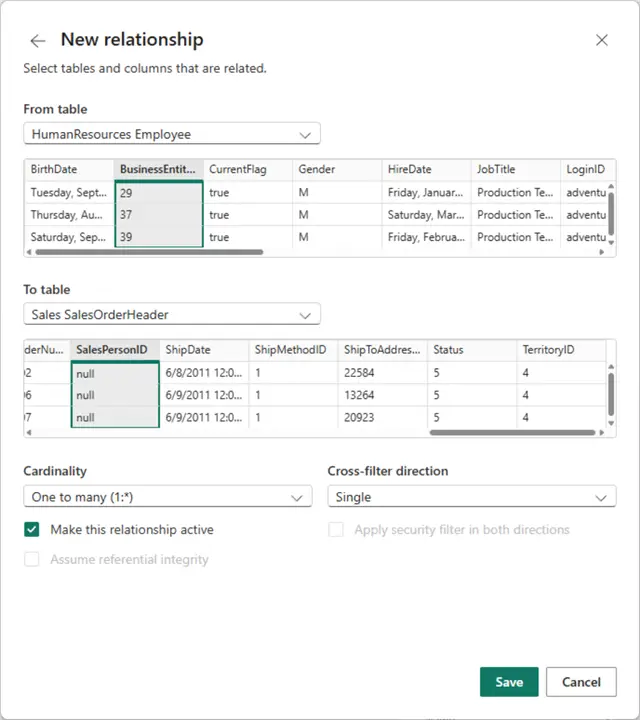
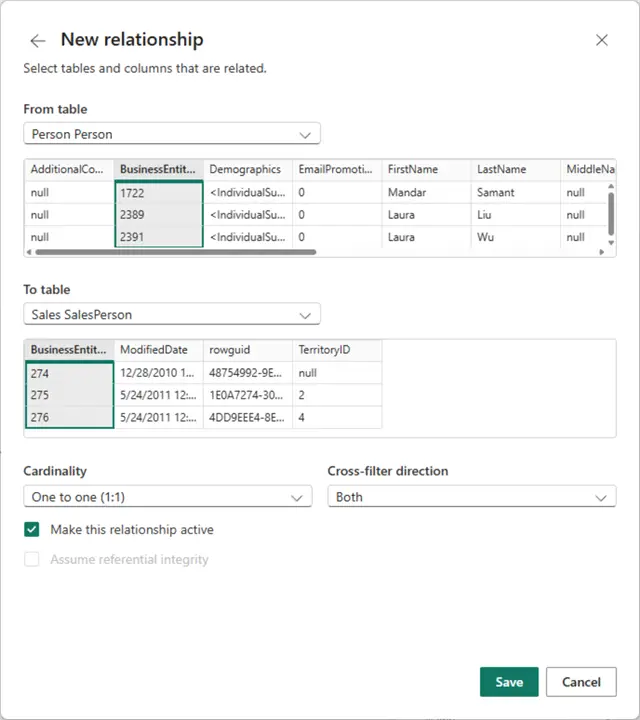
Next, create the following relationships. Ensure you select the highlighted columns representing the different table keys:
- From table SalesPerson to table SalesOrderHeader:
- Primary key: BusinessEntityID
- Foreign key: SalesPersonID
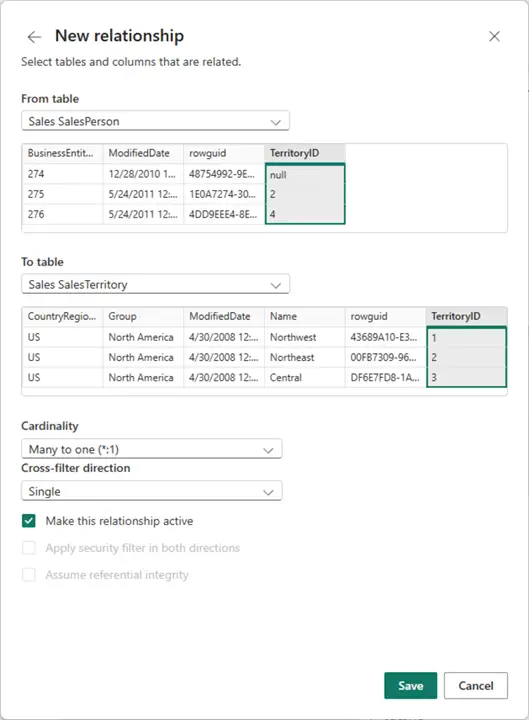
- From table SalesPerson to table SalesTerritory:
- Primary key: SalesTerritory TerritoryID
- Foreign key: SalesPerson TerritoryID
- From table Employee to table SalesOrderHeader:
- Primary key: BusinessEntityID
- Foreign key: SalesPersonID
- From table Person to table SalesPerson:
- Primary Key: BusinessEntityID
- Foreign Key: SalesPersonID
As a result, we have now modified the data model. The solid lines connection the tables mean the relationships are active. The one (“1”) one side and asterisk (*) on the other mean the relationship is one to many, i.e., one salesperson can be found in multiple orders. In more complex scenarios, there may be multiple relationships between the same two tables. However, there can be only one active relationship, while other relationships can be used conditionally depending on the reporting need.
Transform Data
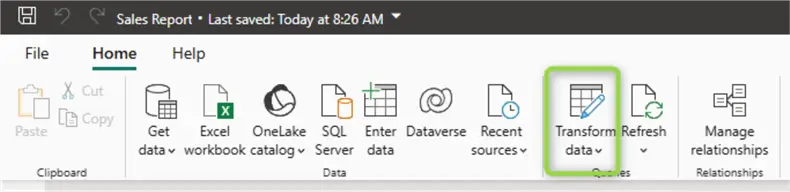
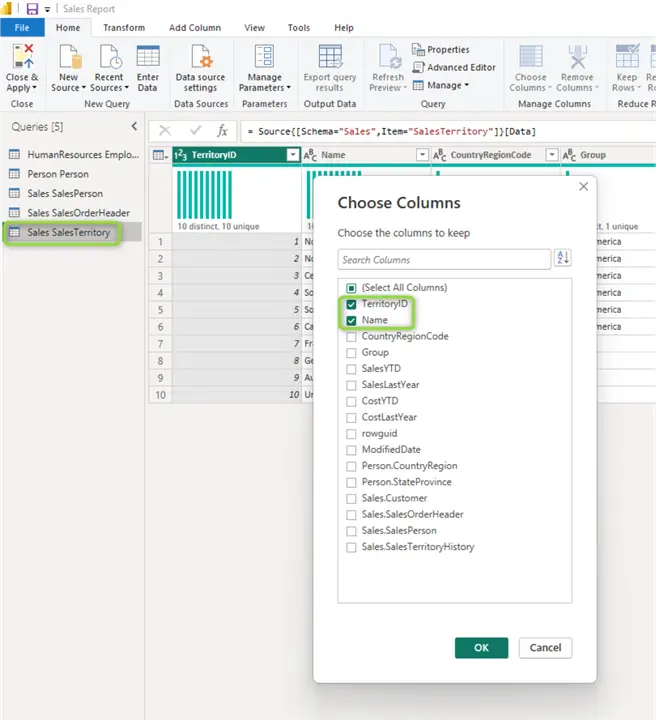
Next, we need to transform and optimize the data model. First let us remove columns we do not need. From the Model view, click Transform data:
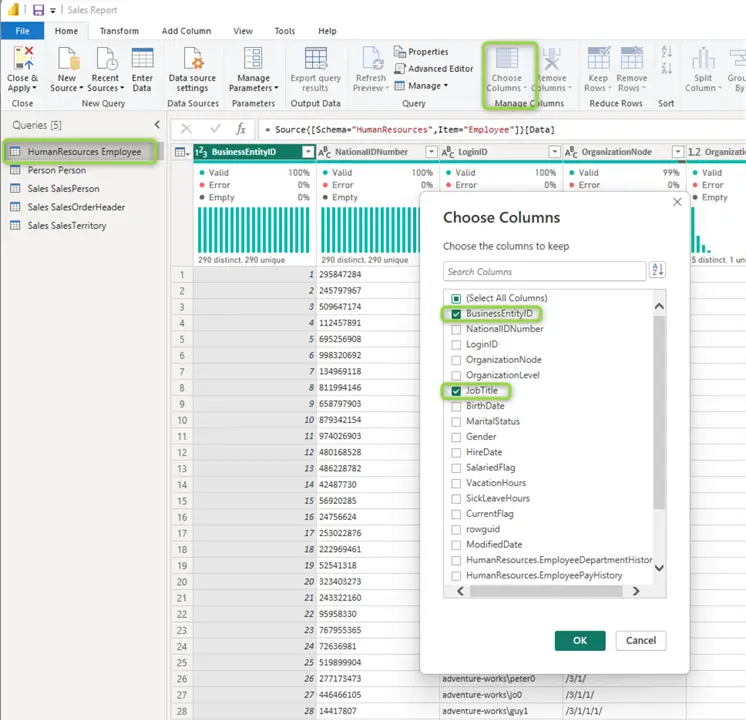
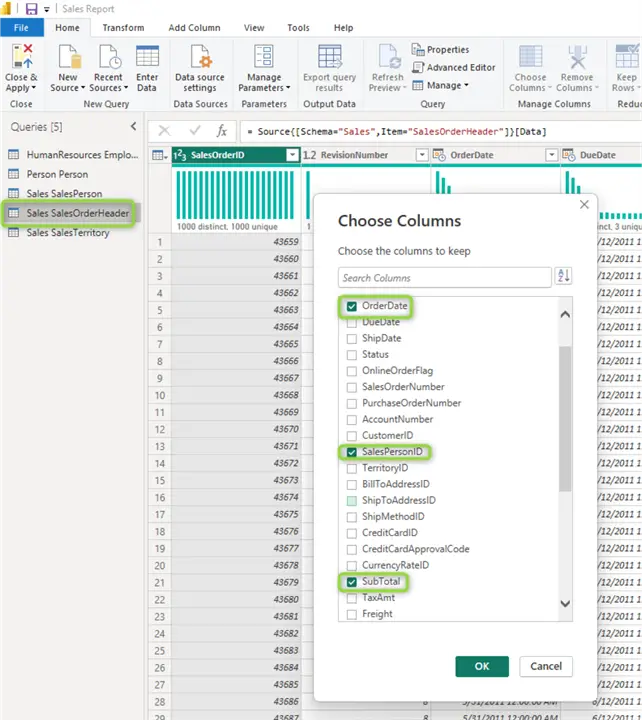
This action will open the Power Query Editor. We have imported five tables; therefore, we have five different queries listed in the query navigator to the left. Select a query starting from the top with Human Resources Employee and select Choose Columns. By default, all columns were selected. Let us deselect all and select only the ones we need:
Employee Table
Person Table

Additionally for the Person table, let us create a column combining the values from the FirstName, MiddleName and LastName columns. Notice some rows have null values for MiddleName. Therefore, we use the special “??” M language operator that acts as T-SQL COALESCE. In other words, if the middle name is null, take an empty string:
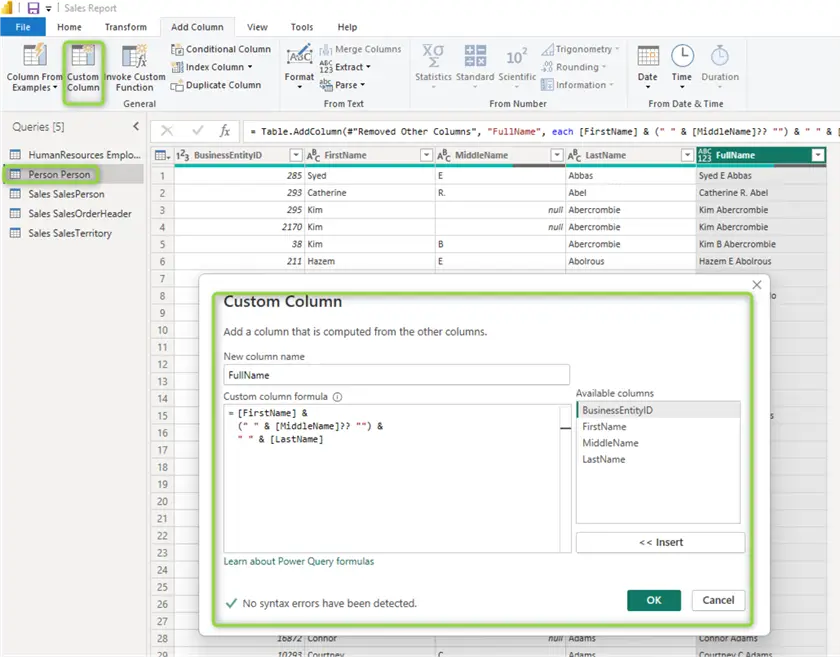
All transformations so far will appear as a sequentially ordered list in the applied steps pane:
From there you can rename, reorder, or refer to individual steps.
SalesPerson Table
Let us also select the relevant columns here:
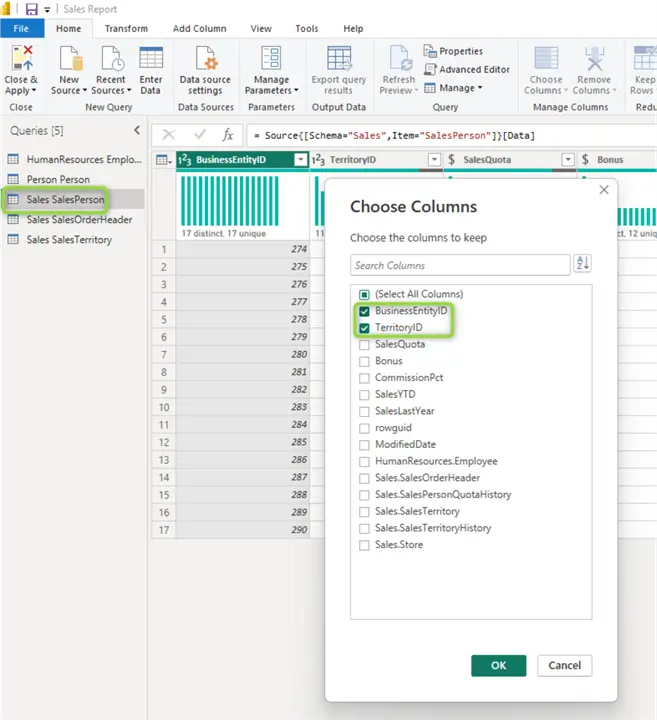
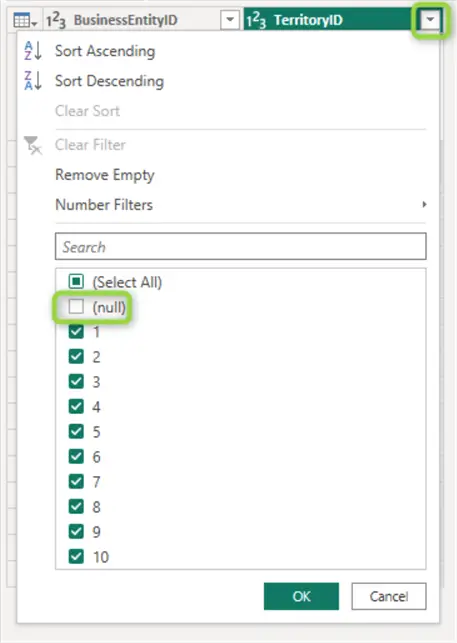
Additionally, let us remove the rows without TerritoryID. Click on the chevron in the TerritoryID column header and deselect null:
SalesOrderHeader Table
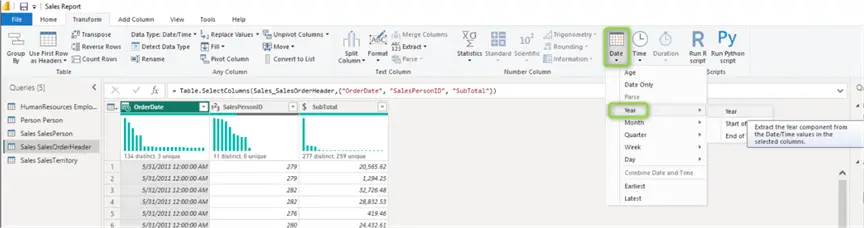
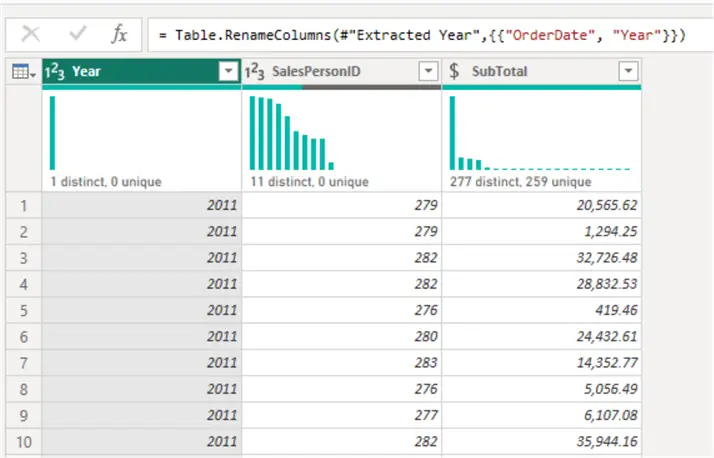
Let us recall we want to report on sales per year. Therefore, it is suitable to extract only the Year part of the OrderDate column. The easiest way to do so is from the Transform ribbon > Date & Time column section > Year > Year.
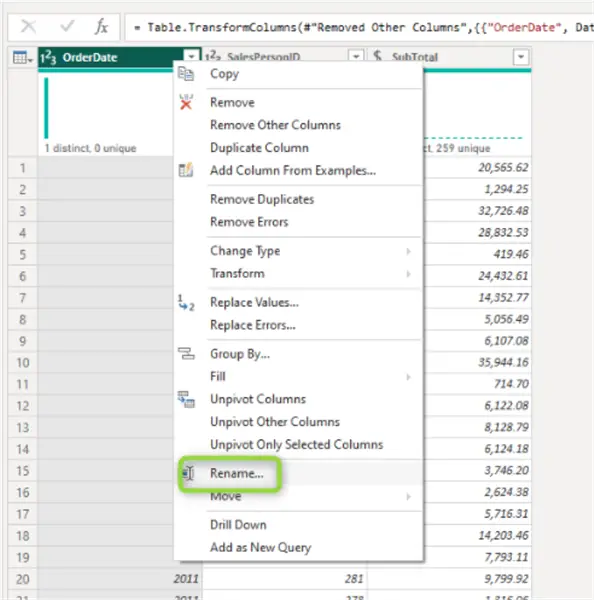
Finally, it makes sense to rename the column from “OrderDate” to “Year.” Right-click on the column header and click rename:
This is what the SalesOrderHeader table should look like at this point:
SalesTerritory Table
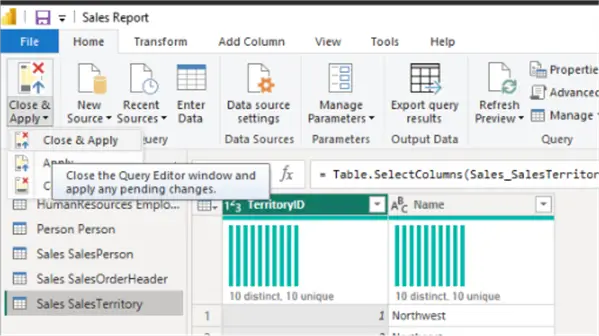
When done with all transformations, click Close & Apply in the top left-hand corner:
Note on Modeling and Transforming Data
I have chosen the modeling and transformation activities in this document to specifically highlight some of the capabilities of Power BI Desktop. Any data transformation is specific to the end goal of unraveling insights and serves a business requirement. On many occasions, it might be better to leverage an already curated or pre-aggregated data product, such as an SQL table or view. If you wish to do so within the context of this scenario, use the view vSalesPersonSalesByFiscalYears.
Visualize Data
Now we are ready to visualize our data.
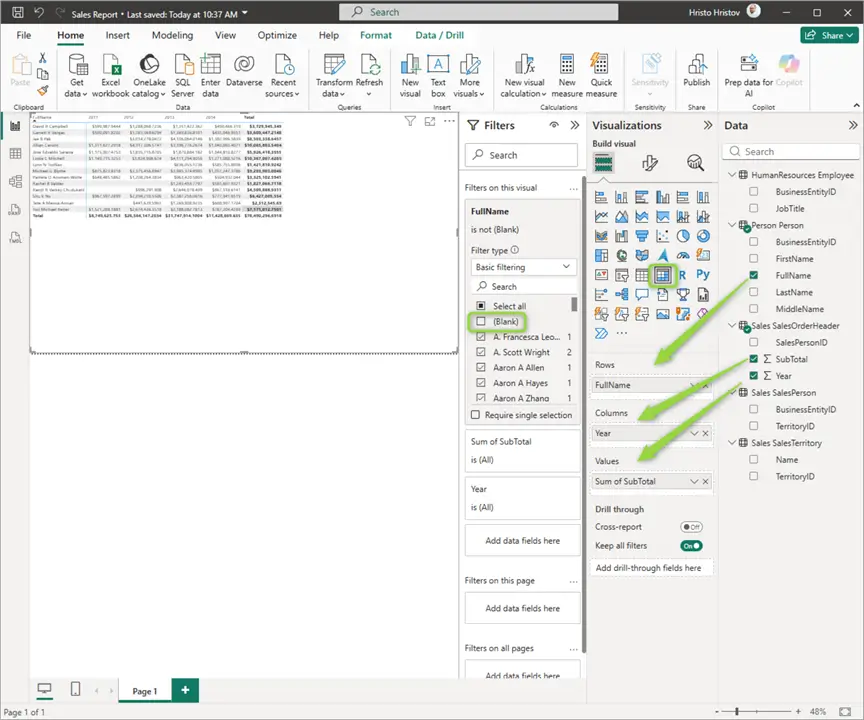
Matrix Chart
Let us first use the matrix visual to sum up sales by year. Drag the matrix visual onto the empty canvas and configure it like so:
| Element | Table | Column |
|---|---|---|
| Rows | Person | FullName |
| Columns | SalesOrderHeader | Year |
| Values | SalesOrderHeader | SubTotal |
Additionally, filter out any blank values from the Filters pane. Such blank values may result from the way Power BI joins the tables to visualize the data.
100% Stacked Bar Chart
To make our report more visual, let us also add a stacked bar chart. Configure it like so:
| Element | Table | Column |
|---|---|---|
| Y-Axis | SalesOrderHeader | Year |
| X-Axis | SalesOrderHeader | SubTotal |
| Legend | Person | FullName |
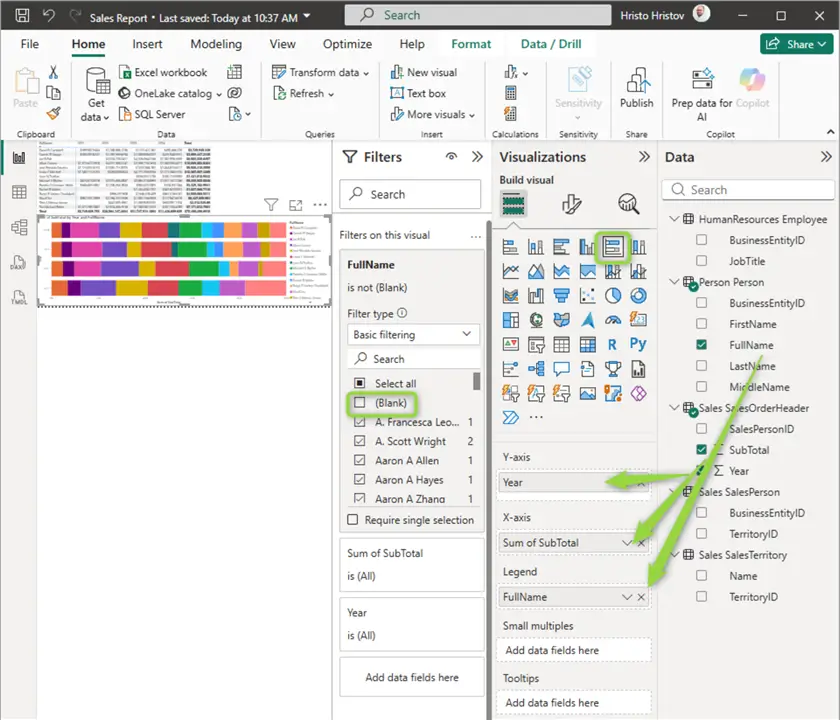
Additionally, deselect any blank values from the Filters pane for the FullName field.
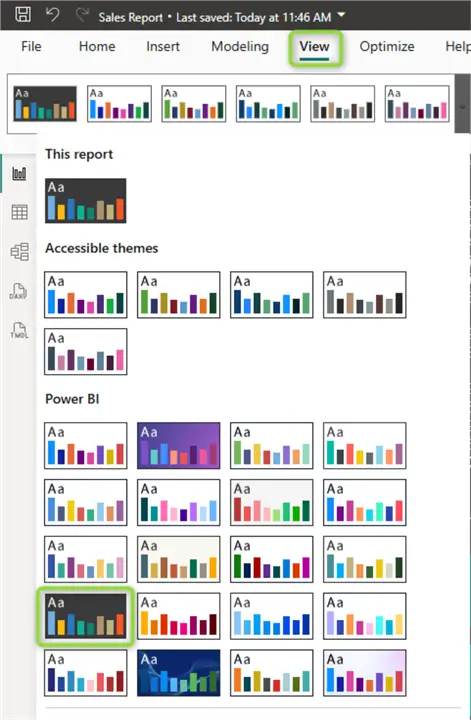
Change Theme
To polish the visualization, we can also adapt the report theme. From the View ribbon, expand the Themes dropdown and pick a theme that you like. Let us try a darker background:
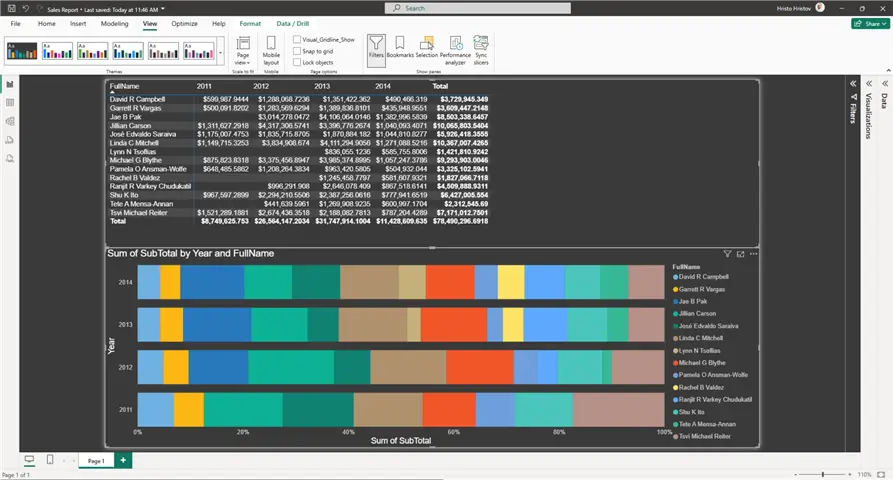
This is what the report looks like now:
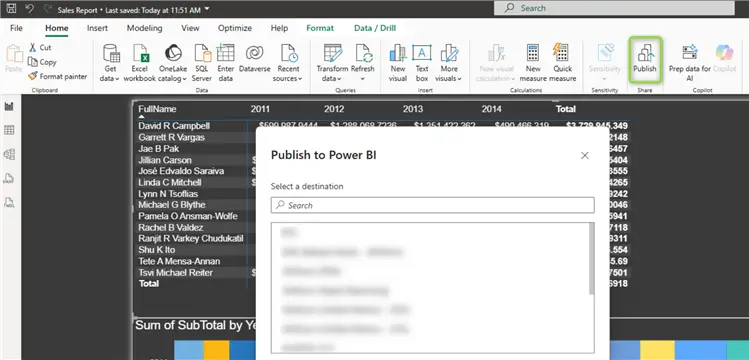
Publish
Usually, the last step after authoring your report in PowerBI desktop is to publish it to the Power BI Service. From the Home ribbon, select Publish. Then Select a destination workspace and click Save in case you are logged in to your M365 tenant:
As good practice before publishing and for every Power BI report you create in general, you can consider:
- Eliminating all unnecessary columns
- Loading data only required for your report
- Limiting the number of visuals in the report and on each page.
Power BI Versions
When discussing Power BI Desktop, we should also mention the other platform variations that altogether create the Power BI ecosystem for creating and sharing diverse types of reports. The following table provides a concise summary of all Power BI products out there:
| Business need | Use this | Functionality |
|---|---|---|
| Create reports, model and transform data | Power BI Desktop | Full data modeling and design tools. |
| Share with team | Power BI Service Microsoft Fabric for Power BI users | Collaboration and sharing features, exposing your data to the organization. |
| View reports on a mobile device | Power BI Mobile apps | Experience optimized for mobile devices. |
| Design printable reports | Power BI report builder | Create print-friendly paginated reports. |
| Host reports on-premises | Power BI report server | Like SSRS, designed to host Power BI reports (pbix), Excel files, and paginated reports (.rdl). |
| Embed reports | Power BI Embedded Analytics | Allows you to embed your Power BI items such as reports, dashboards, and tiles, in a web application or in a website. |
Settings and Preview Features
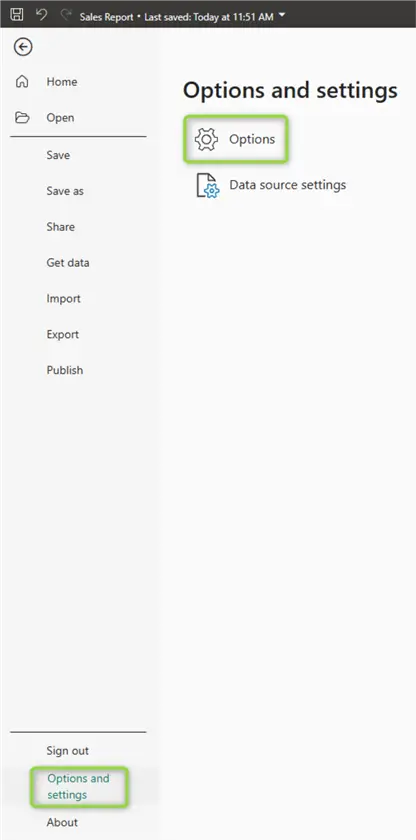
Out of the box Power BI Desktop comes with a rich set of features enabling functionality for connecting, modeling, transforming and visualizing data. Nevertheless, this is a living product, and Microsoft keeps developing and improving it. As a result, some new features are in “preview mode.” From the File menu you can open Options and Settings, then click Options:
The settings appear in two categories: Global for settings impacting any report you author, and Current File or settings related to the current report you are working on. Under each category you will find settings organized in sections, according to general functionality, e.g., Data Load, Security, etc. I want to pay specific attention to the Preview features section:

In this section you will find the most modern and recent features. Some are on by default, while others require you to switch them on explicitly.
Continue Learning
In this document we saw a quick overview of all core functionalities of Power BI Desktop – from connecting to data, to transforming, and modeling to visualizing data. Both Power BI standalone and as part of MS Fabric sit at the forefront of democratizing data and analytics to bring powerful insights to everyone, across all levels of the organization. While the platform is suitable for both business users and professional developers due to its flexibility and various features, a few learning pathways stand out.
For DBA’s, Power BI may not be an instinctive choice but can offer a lot on the connectivity and visualization fronts. A DBA can use Power BI to monitor database performance metrics across servers and instances. DMV’s can be imported to Power BI and refreshed automatically and regularly to reveal query execution times, resource utilization, and storage allocation. For capacity planning, a DBA can opt for Power BI desktop to build a report to show database growth over time and proactively plan resource allocations.
For data developers and data professionals the Power BI platform is a powerful tool to create holistic reporting solutions. Developers can leverage the Power BI Rest APIs to trigger semantic model refreshes and engineer event-driven data workflows. Additionally, the Power BI report embedding functionality enables integrating any report with external websites and serves as full-fledged analytics framework. Python & R professionals can use the integrated runtime functionality to develop complex visualizations or to run statistical distributions tests.
Business Intelligence (BI) Engineers are another group that can benefit from Power BI. For example, Data Analytics Expressions (DAX) is a library of functions and operators used to build formulas in Power BI. On the other hand, the M query language is the fuel behind the Power Query engine used to combine and transform data from multiple sources. As we saw in this document, BI professionals can build or modify a dimensional data model or import an existing one from a wide choice of database or data warehouse sources. Finally, in terms of advanced analytics, Power BI Desktop comes with incorporated advanced analytics functionality from plotting trend lines, forecasting and anomaly detection to AI-powered Q&A capabilities.
Whatever your role is, Power BI in its many versions should have something to get you started exploring your data and creating impactful analytics solutions.
Next Steps
- Power BI Quick Reference Guide
- Power BI Training
- Microsoft Fabric vs Power BI
- Power BI Connect to SQL Server – DirectQuery vs. Import Mode
- Power BI for Business Intelligence

Hristo Hristov is a seasoned data professional with 10+ years of experience spanning the intersection of data engineering and smart manufacturing solutions. Since 2017, he has specialized in implementing advanced analytics solutions for bridging the IT/OT gap.
A technical writer with over 80 published articles on data and AI technologies, Python development, and cloud solutions. Passionate about transforming complex data into business value through innovative applications of Azure Data Platform, Python, IoT solutions, databases, and other cloud technologies.
Currently applying Industry 4.0 best practices, focusing on IoT connectivity, and implementing data and AI systems in manufacturing. Hristo holds a degree in Data Science and several Microsoft certifications covering SQL Server, Power BI, and related technologies.
- MSSQLTips Awards
- Achiever Award (75+ tips) – 2026
- Rookie of the Year – 2021
- Author Contender – 2022/2023/2024/2025


Thanks – this is really detailed and useful