Problem
Power BI is becoming widely used for reporting and data analysis. There are many different versions of Power BI and the features that are offered and this article provides an overview of what is available.
Solution
What is Power BI
Power BI has been described in many ways, but one very simple and yet comprehensive way I like to describe it is that it is an assemblage of software services, connectors and apps that work together to enable organizations and individuals collect divers unrelated data from disparate sources, cleans, manage and analyze the data to produce an end product of visually immersive, coherent and highly interactive insights.
Power BI as a business intelligence tool boasts of a robust and user-friendly interface which allows users to easily pull real-time data together from an ever-increasing range of On-Premises, Cloud-based sources of data, Salesforce, Excel spreadsheets and SQL Server databases.
Power BI makes it easy for organizations to connect to data sources, cleans the data, analyze the data, visualize the data and discover insights from the data, and on top of that, it allows for easy sharing of the end reports to report end users.
In summary, Power BI includes the following Microsoft products: Windows desktop application usually called Power BI Desktop, a cloud-based service called Power BI service, a mobile version known as Power BI Mobile as well as a pixel-perfect version known as Power BI Paginated Reports Builder.
All these parts of Power BI will be described in a summarized detail later in this article, but before then let us get some information as to how this powerful business analytics tool came about.
A brief history of Power BI
The idea of Power BI started in 2006 within the SQL Server Reporting Services (SSRS) Team at Microsoft under the leadership of Amir Netz. The project code named “Gemini” as it was known then harnessed the Power of SQL Server Analysis Services (SSAS) and made it become available as an in-memory engine. Project “Gemini” was later renamed “Power Pivot” in 2009.
In other to compete with the then amazing visualizations capabilities of Tableau, Microsoft released “Power View” as part of SharePoint in 2012. To better enhance their market space in visualizations, Microsoft released “Data Explorer” in early 2013, but like Power Pivot, this was only as an ad-in in Microsoft Excel as at then. However, the idea behind Power BI was not far away at this point.
To make it easier to access data and bring it into Power Pivot, Microsoft did enhanced and improved the capabilities of Data Explorer, and late in 2013 it was renamed as “Power Query” which we know about much today. Again, in those early times, Power Query was only available as an ad-in in Excel like Power Pivot.
To ensure reports built can be easily distributed and stored in a central repository accessible to anyone with access, in January 2015, Microsoft announced the new “Power BI Service” that could be accessed via PowerBI.com. At this time, the word Power BI was just a phrase that was being used to describe the complexity in the Power Pivot / SharePoint solution used at that time, but Power BI as a name of the tool gained momentum and popularity after this January 2015 announcement.
After the January 2015 announcement, Power BI remained in Preview mode until July 2015 when it became generally available to all. So, the whole story about Power BI though started in mid 2000s but became more popular and available to use in 2015.
What are the different versions of Power BI
Currently, Power BI consists of about five different versions. How we use these different versions depends of what kind of reports we want to create, the way the end users will access the reports or the type of access license we have purchased.
The versions all work together in one form or the other to ensure you can create, share, and consume insights from your organization’s data in a way that serves you or your organization best.
The versions include:
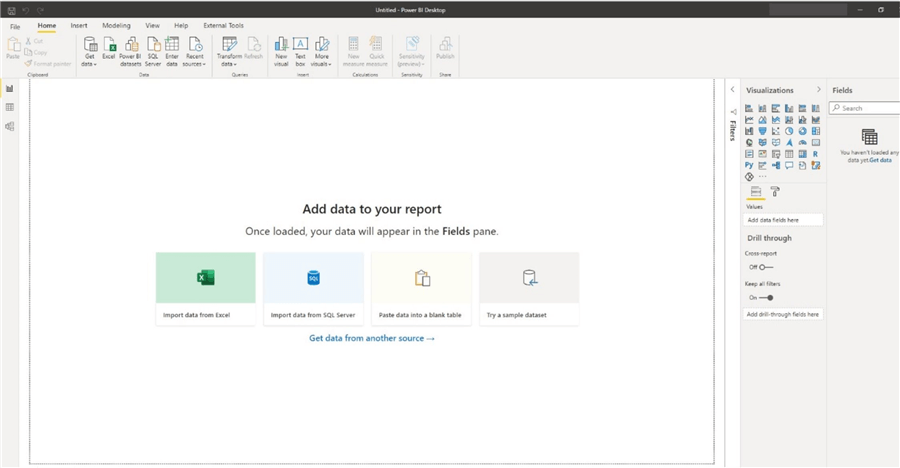
- Power BI Desktop – Windows desktop application, primarily for managing data, designing, and publishing reports to the Service.
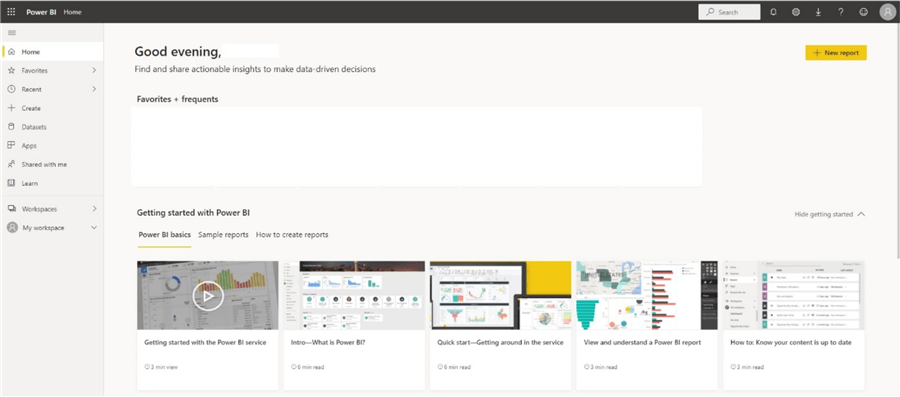
- Power BI Service – SaaS-based (software as a service) online service, usually simply referred to as PowerBI.com.
- Power BI Mobile Apps – Mobile (Android and iOS) devices-based app. Also available for Windows phones and tablets.
- Power BI Reports Builder – Version for creating “pixel-perfect” paginated reports to share in the Power BI service.
- Power BI Reports Server – On-Premises Power BI Reporting solution for organizations that prefer not to store data or reports in the cloud-based Power BI Service.
Besides these five mentioned, there is also the Power BI Embedded, which uses Power BI REST API to build dashboards and reports into the custom applications that serves Power BI end users, as well as non-Power BI users.
Power BI Desktop
Power BI Desktop is a free windows desktop application which you can easily download and install on your local computer. It is primarily the development area for creating reports which are later published to Power BI Service.
You can download and install the Power BI Desktop via the official Microsoft site here. For those using windows computer, the supported Operating Systems currently include Windows 10, Windows Server 2012 R2, Windows Server 2008 R2, Windows Server 2012, Windows 7, Windows 8, Windows 8.1, Windows Server 2016, Windows Server 2019. Also, Microsoft Power BI Desktop is available for 32-bit (x86) and 64-bit (x64) platforms.
Power BI Desktop is totally free for users but might require some form of license to be able to enjoy the full capability of leveraging Power BI Service to distribute reports created in Power BI Desktop. It usually has up to 1GB of memory.
Power BI Desktop is made up of five components, some of which it inherited from its Excel ad-in days. These components include:
- Power Query Editor, which is a data connection component that allows you manage, transform, combine, and enhance data from desperate sources.
- Power Pivot, which is a data modeling component used for developing data models.
- Power View, which is a data visualization component used for creating interactive charts, graphs, maps, and other visuals.
- Power Map, which is also a visualization component used for creating immersive map visuals.
- Power Q&A, which is a question and answer engine that allows you to ask questions about your data in easily understandable usual language.
As Power BI Desktop is updated by Microsoft monthly, there is always something new to the tool. So, it is recommended that you should keep an eye on these updates. You can get more information on the latest updates via the official Microsoft documentation here.
You can also get some more information relating to Power BI Desktop via this Microsoft documentation here.
Power BI Service
The Power BI service, sometimes referred to as Power BI Online or Power BI.com, is a SaaS-based online service. It supports light report editing and collaboration for teams and organizations. Like Power BI Desktop, you can connect to data sources in the Power BI service, however, the modeling capability is limited as compared to Power BI Desktop.
Power BI Service is mostly used as a collaboration or distribution version of the tool, where reports are being developed into dashboards, and dashboards being converted to Apps for the end users. However, nowadays, Power BI service is gradually turning into a version which is used to model data, prepare data, and manage security of data in the cloud. For instance, Data Flows are created in Power BI Service which leverages Power Query in the cloud.
Besides hosting reports created in Power BI Desktop, Power BI Service also hosts Paginated Reports created in Power BI Report Builder.
Just like Power BI Desktop, Power BI Service is constantly being updated with new amazing features, you can get more information on what is new in it anytime via the official Microsoft documentation page here.
Also, to gain a better understanding on what Power BI service can be used for or how to use it effectively I would recommend that you take a look through this 15 minutes read Microsoft documentation on everything Power BI Service.
Power BI Mobile Apps
Power BI as a business intelligence tool offers a set of mobile apps for Windows 10, Android, and iOS mobile devices. You can connect to and interact with both on-premises and cloud data in the mobile apps using your phones, smart watches, or tablet devices. Get more information on Power BI Mobile Apps from the official Microsoft documentation.
Usually, you create the reports in Power BI Desktop or Power BI Reports Builder, then publish it to the Power BI Service where dashboards and created and users can view and interact with these reports or dashboards within a mobile device like Windows 10 devices, iOS devices (iPad, iPhone, iPod Touch, or Apple Watch) or Android phone or tablet.
Likewise, reports published to the Power BI reports server, which is on-premises, can be viewed and interacted with via the mobile devices listed above too.
You can get more details on all updates and what is new in Power BI Mobile Apps from the official Microsoft documentation on Mobile Apps here.
The diagram below shows the layout of the “home page” of the Power BI Mobile Apps and its applicable to Android, iPad, and iPhone. The diagram was adapted from the Microsoft documentation page for a quick tour of the Mobile App home page.
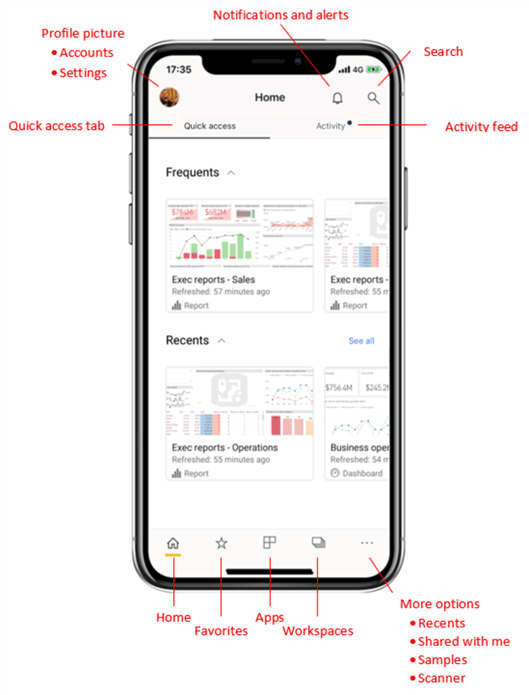
You can get more details on how to use and understand the layout of the Power Bi Mobile Apps here.
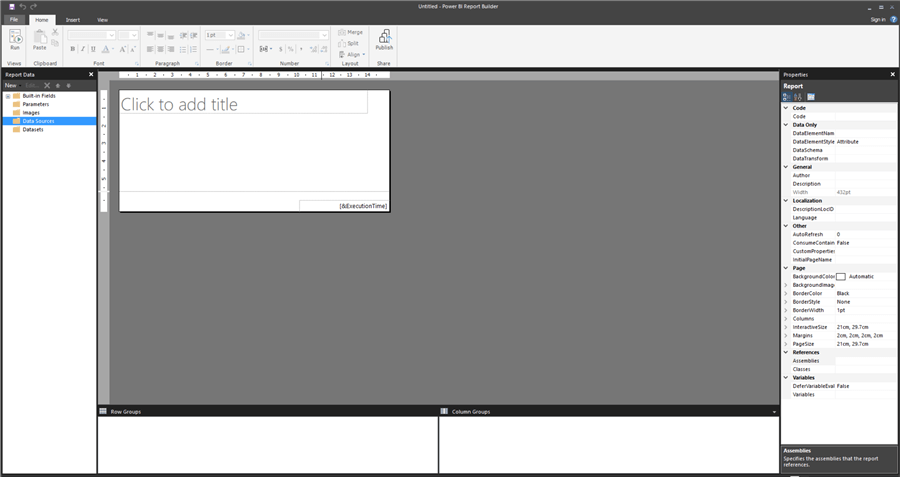
Power BI Reports Builder
Power BI Report Builder is the standalone tool used for creating “pixel-perfect” paginated reports that you can then publish to the Power BI service for sharing purposes. It is usually used to author reports that needs to be printed or shared, that is why it is called “paginated” as it can be formatted to fit well on a page.
The word “pixel-perfect” is usually used to describe paginated reports because you can control exactly how you want the report layout to be like. When a table spans into multiple pages, paginated reports can display all the data in a table.
Currently, the Power BI Reports Builder do not boast of the numerous data source connectors found in Power BI Desktop, but it has a connector to some common data sources (as is at the time of writing this article) as listed below.
- Azure Analysis Services
- Azure Synapse Analytics
- Dataverse
- Microsoft Azure SQL Database
- Microsoft SQL Server
- Microsoft SQL Server Analysis Services
- Oracle Database
- Teradata
It is also important to know that you can also use a Power BI dataset connection and a blank “Enter Data” source. Microsoft are adding to this list every time however, so it is expected that this list would extend to other data sources you are familiar with in Power BI Desktop soon.
You can get some detailed information on most things you would need to know on how to use Power BI Paginated Reports Builder in this article. Please also take time to read through this FAQs documentation by Microsoft on Power BI Paginated Reports so you get more answers to questions you may have. You can also get more ideas on how you can create a paginated report in this Microsoft documentation.
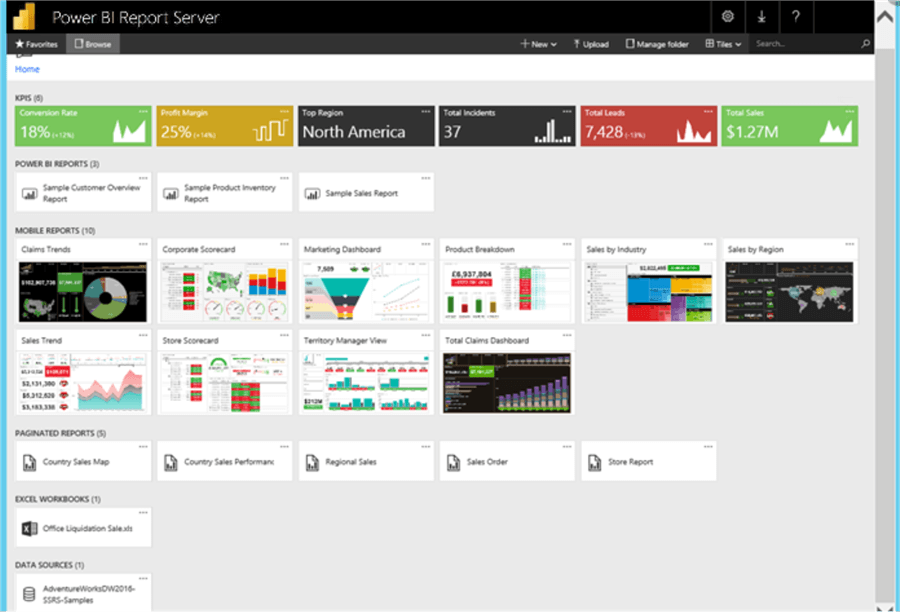
Power BI Reports Server
Power BI Report Server is an on-premises report server with a web portal which like Power BI Service you can manage and display reports and KPIs. There are reasons why organizations chose to go the on-premises way to manage and display their reports and KPIs, this could be either due to data regulation laws applying to their particular industry or factors relating to not having the required infrastructure or connectivity to reliably and effectively link to cloud SaaS platforms.
End users can access these reports either via a web browser or a through mobile devises. Some others schedule the reports delivery to end users via emails. Get some more information on Power BI Reports Server here. You can download Power BI Reports Server using this link.
It is important to note that Power BI Reports Server is not updated monthly, usually updates come from Microsoft every three or four months. If you need to get some detailed comparisons between Power BI Reports Server and Power BI Service please see this Microsoft article.
Power BI Embedded
Power BI Embedded is a platform-as-a-service (PaaS) analytics solution, where developers can use Power BI REST API to embed reports and dashboards into an application for their customers. It simplifies Power BI capabilities by helping you to quickly add stunning visuals, reports, and dashboards to your apps in a similar way apps built on Microsoft Azure uses services like IoT and Machine learning.
Power BI Embedded can be used as a third-party business intelligence service that enables you to visualize application data, rather than building that service yourself.
It is different from Power BI Premium in that unlike the later which is a software-as-a-service (SaaS) analytics solution that gives your organization a single view of their most critical business data, the former is a platform-as-a-service (PaaS) analytics solution. Another disparity between Power BI Embedded and Power BI Premium is that the former is a pay-as-you-go feature, while the latter requires a monthly subscription fee.
Power BI Embedded developers usually make use of the following common tools to do their job.
- Power BI Desktop
- The Azure Portal
- Visual Studio Code
As at the time of writing this article, Microsoft has just released a new version of Power BI Embedded known as “Embedded Gen2“. You can see details of this new release in this Microsoft documentation.
You can get more information on what Power BI Embedded is all about here.
Who uses Power BI
Like many other Business Intelligence tools, Power BI tend to be predominantly used by skilled Data professional including data analysts, developers, data scientists and BI analysts within an organization. However, unlike most other business intelligence tools, Power BI is created to be easily used by anyone within an organization that have some level of Excel proficiency due to its user-friendly nature and comparability in its features to other Microsoft Office tools.
The way Power BI is used nowadays depends on the role a particular employee occupies in an organization. It can also depend on the skills and trainings any user currently has. For instance, an employee with a strong data warehouse and modeling background would find it very easy to develop data models and manage creation of tables and relationships between the tables in Power BI. This might not be a skill for usual business users who are using their Excel knowledge to transition to Power BI. So, data scientists may want to use Power BI to visualize and explore their data whereas a BI developer might be developing data models and flows in Power BI, and the business analysts use the created models to create Power BI reports and dashboards for the business.
You would find that there are many roles that come with Power BI nowadays including Power BI analysts, Power BI developers, Power BI administrators as so on. For sure, not all organizations have the capacity to bring in an employee for each of these roles to manage Power BI in the organization, some have been able to achieve all roles using one skilled employee.
Comparing Power BI with Main Competitors in BI Space
Power BI has become the leading BI tool for most organizations in the world now, this is evidence in the reports from Gartner Magic Quadrant for the past fourteen years (and leader in the BI space for 3rd year in a row as of February 2021). See the official Gartner Magic Quadrant as released in February 2021 below.
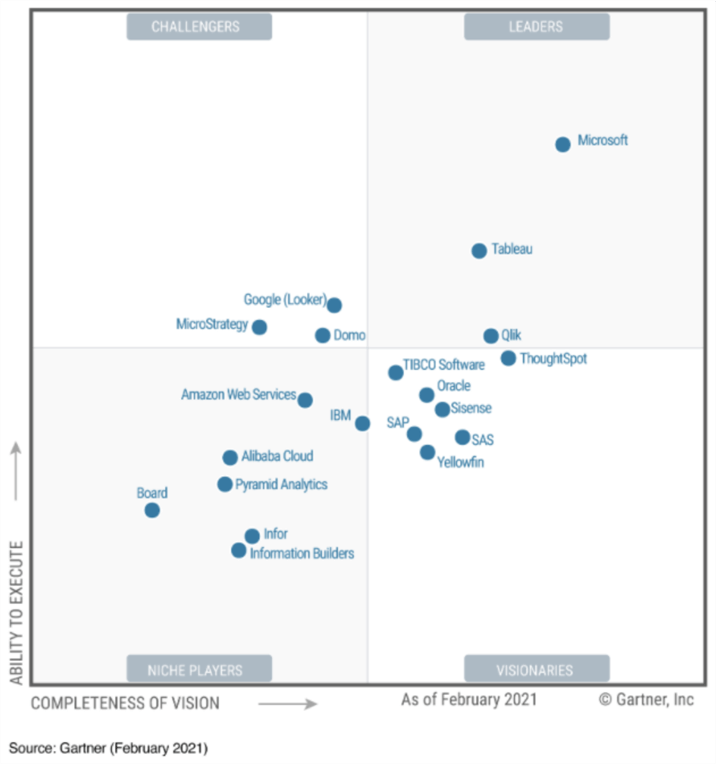
It is essential to understand why Power BI might be your chosen option as BI and Visualization tool. There are loads of options in the Business Intelligence and Data Visualization market, and these options are all competitors with Microsoft Power BI based on what they do, how they do it and their market share.
So, the main competitors of Power BI include Tableau, QlikView, Looker, Board, Dundas BI, Qlik Sense, and Cognos. Among these the first two are the major market share competitors to Microsoft Power BI as also demonstrated in the Gartner Magic Quadrant in the diagram above. To better understand certain features that would let you choose one out of the others, please see the snapshot below.
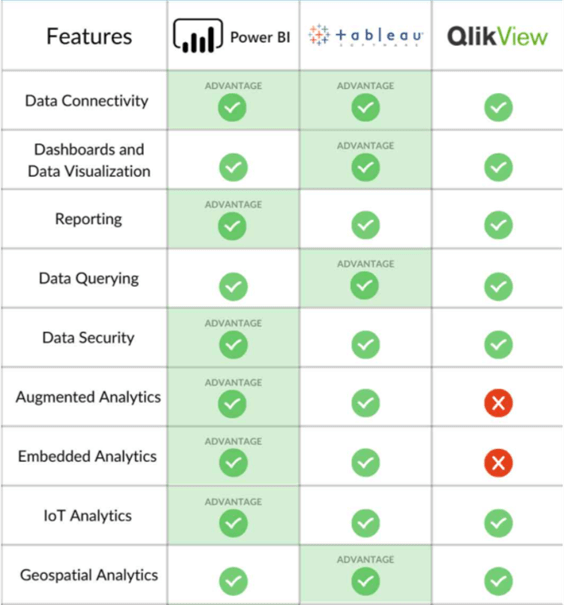
Source: SelectHub (2021)
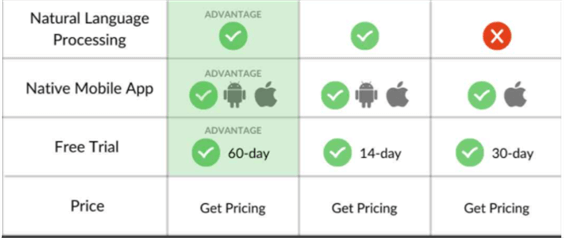
In terms of pricing of each of the main competitors of Power BI see the snapshot below to get some idea on how much it might cost you to manage any chosen tool for your Business Intelligence and data visualizations needs. Please note that these costs might change in the future, but this is roughly how much currently, and there are other forms of licensing you might get from each tool, depending on your business need. For instance, Power BI has the Pro license, Premium Capacity, and the Premium Per User license. Thus, the type of license you choose has its own cost and reasons for choosing such. I will talk more on licensing in Power BI later in this article.

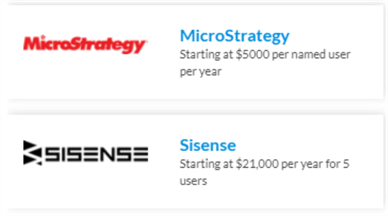
Source: SelectHub (2021)
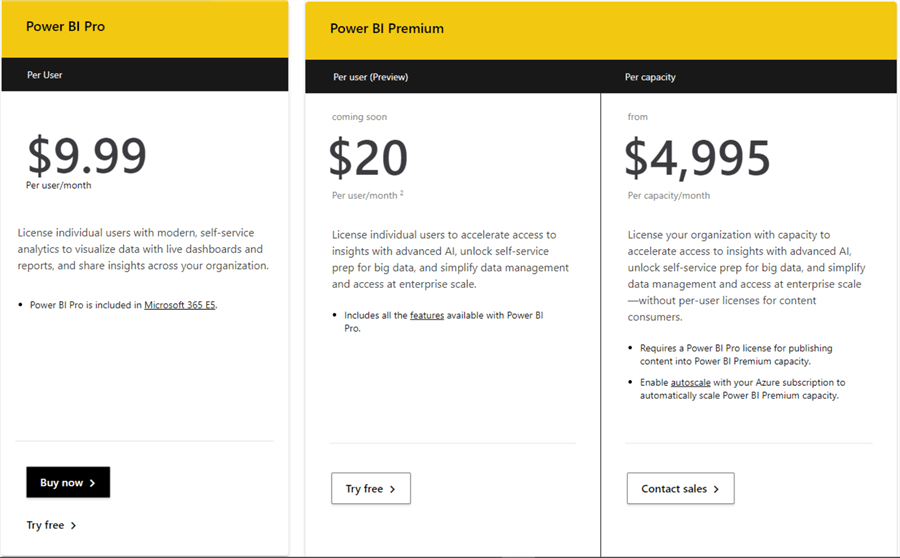
Power BI Pricing
In Power BI Service, the type of per-user license you have is what determines the level of access you get, and this also determines whether you can access a Premium workspace or not. For you to use the Power BI Service at all, you would require a license at least.
Power BI Desktop on the other hand is totally free. So, when you create visualizations (reports) you do this for free. You only need a license when you need to publish the reports to the Power BI Service and/or share with others within Power BI Service.
Currently at the time of writing this article, Power BI has two kinds of licenses including Standard and Premium. There is also the Power BI Embedded licensing which I will talk about briefly later. I will now describe each of these licenses briefly as follows.
Standard License:
The standard license includes the self-service Power BI Pro license which allows Power BI admins to assign per user licenses. With the Pro license there is a per user monthly fee for the licenses. This type of license enables collaboration, publishing, sharing, and ad-hoc analysis. Content is also saved to shared storage capacity that is fully managed by Microsoft as it only uses a shared and limited capacity to process content.
Power BI users who are assigned a Power BI Pro license can only collaborate with other Power BI Pro users.
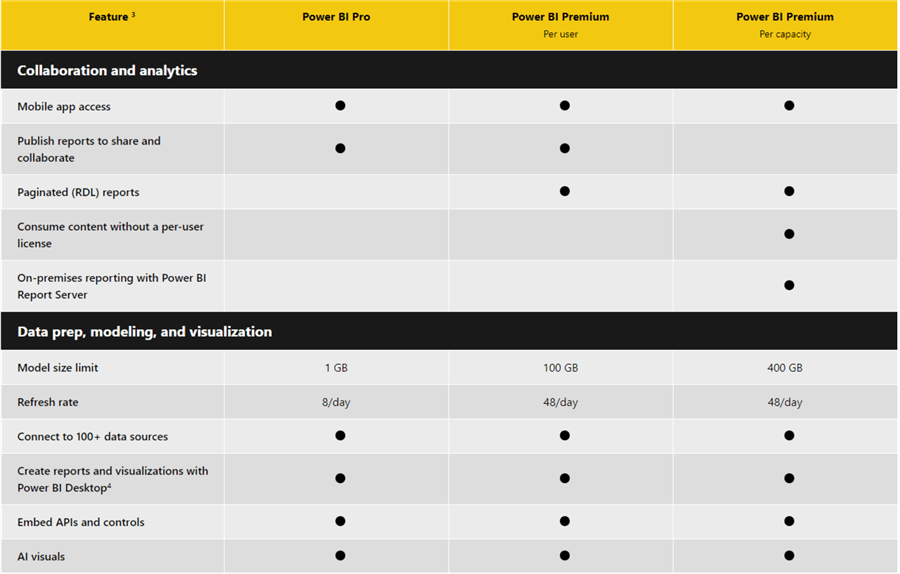
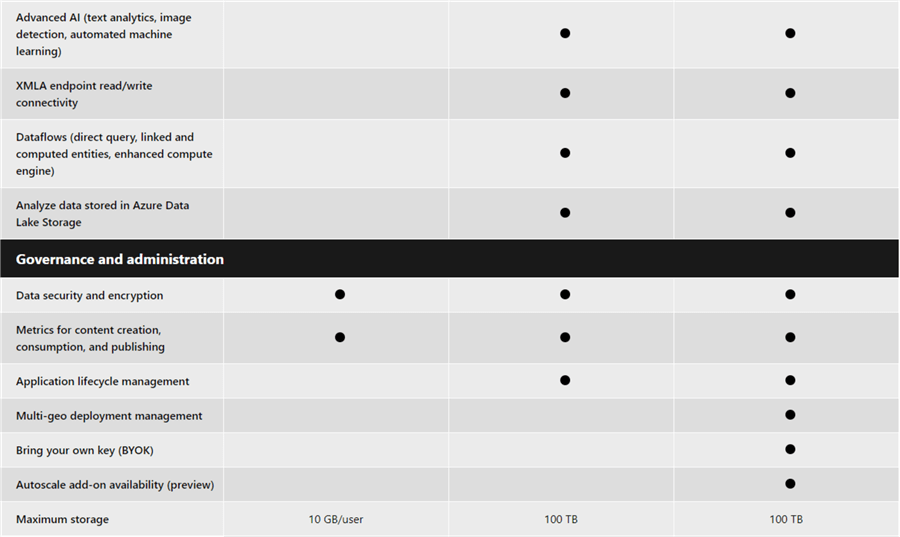
Premium License/Capacity:
With Power BI Premium license, a capacity is allocated to an organization which allows its users to be able to access contents stored in Premium capacity and distribute the content to users who don't have Power BI Pro licenses unlike the standard license option. It also ensures users have access to all Premium services within Power BI Service including access to insights with advanced AI and unlock self-service prep for big data.
There is a new type of Premium capacity license for Per-User purposes released recently by Microsoft. It’s known as “Premium Per-User” license which at the time of writing this article was still in Preview. Please see details of each kind of license summarized in the diagram below.
You can get more details on Power BI licensing for your organization in this Microsoft documentation.
Also, you can see a detailed comparison between each license plans inn Power BI Service. Diagrams sourced from here.
Sometimes you might want to have an estimated price for a Power BI license for a specific number of users, I would recommend you can use the Power BI Premium calculator to do so easily.
This article has not gone very in-depth to explain all you can get to know in Power BI Licensing, but I have provided links on the next steps on articles that dealt with Power BI licensing in much more detail, please do read if you need more information.
Power BI Embedded License:
Unlike the other licensing plans, Power BI Embedded licensing is based on refreshes on a Power BI reports page also known as page renders. Basically, any action you perform in a Power BI report within an Embedded report would lead to a render action.
For Power BI Embedded, pricing depends on the note type chosen as well as the number of nodes deployed. There are different types of node types depending on the number of V-Cores and RAM as summarized in the table below.
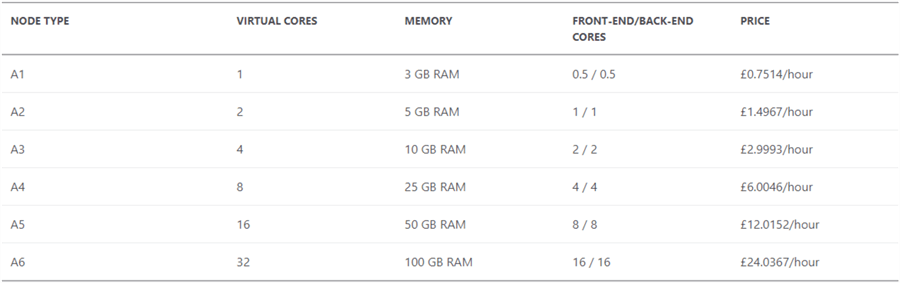
Table was sourced from Microsoft’s Power BI Embedded Pricing page.
Next Steps
- See this documentation about Power BI from Microsoft here.
- You can download Power BI Desktop here.
- You can get the Android Mobile App here.
- You can get the iOS Mobile App here.
- You can get the Windows Mobile App here.
- Checkout this article in RADACAD on Power BI Licensing to get more information on all you need to know in this aspect.
- You can get some more details around history of Power BI here.

Kenneth A. Omorodion is a Microsoft Certified Solutions Associate (MCSA) with 12+ years of enterprise application experience in Power BI, DAX, Microsoft Fabric, Business Intelligence, data warehousing, SSRS, T-SQL, and Azure. Beyond his technical skills, Kenneth has expertise working with stakeholders’ and business leaders to help them better understand key insights. He has a great track record of successfully delivering full life cycle Business Intelligence and data solutions to organizations with measurable business impact.
- MSSQLTips Awards
- Achiever Award (75+ Tips) – 2025
- Author of the Year-2021
- Author Contender-2022/2023/2024


Really interesting information, thanks for this article!