Problem
You learn a lot over time when working with a piece of technology and I have learned many things about Power BI. To help people that are new to using Power BI or just looking for more tips, I put together a list of things I know now that I wish I would have known when I started working with Power BI (aka PBI).
Solution
Power BI has broken onto the visualization and analytic scene with a breakneck speed; with its new releases occurring just about every month. Compelling changes have occurred over its somewhat short life span of just a few years. As with any new product, there are lessons that are learned the easy way and others that seem to take the hard way to fully understand, implement, and put into production. As such, there are several areas within Power BI that are "What I wish I knew" items. The list of items crosses various parts of Power BI and includes elements such as understanding the difference between the Power BI Service and Power BI desktop and determining the difference between the various licenses that are required to use Power BI.
Although, not all the topics we will cover require a full example, it is still recommended that you download the latest version of Power BI desktop. Additionally, we will be using the WideWorldImportersDW database as a basis for our data sources; this database can be downloaded from here. If you need a refresher on bringing data into Power BI please see: Querying SQL Server Data with Power BI Desktop. Let’s get started with our list of items that I wish I knew when I started working with Power BI.
Power BI Desktop vs. Power BI Service
As you can see in the introduction, one of the first recommendations in many Power BI tips is to download Power BI Desktop, especially the latest version. Power BI Desktop is a local application that is installed on, appropriately, a local desktop or laptop. There are various system requirements which include only Windows 10, 7, 8, and 8.1 (and some Windows sever machines, but I am unsure why you would install there). As you can see Linux and Macs are not included. Also, although not a requirement, it is beneficial to use a machine which has a high level of memory for use by Power BI.
With that said, datasets, reports, and dashboards can be created online in the Power BI service which is the online presence and website for Power BI. The site houses all the forward-facing web related items and is the location where dashboard and related tables developed in Power BI desktop are published. Many, but not all the features in Power BI Desktop are available in the service. However, the "not all" features include many handy features and most new beta features. Additionally, I find Power BI Desktop to be easier and often quicker to interact with and would recommend anyone who is a Power BI Developer to use the Desktop App. This tip, Compare Power BI Desktop vs. Power BI Online, reveals additional detail differences between the two products. Overall, the service is great for a quick adjustment, but Power BI desktop should be the go-to IDE for most Power BI developers.

Premium vs. Pro users / licenses
One of the more confusing and often hard to understand parts of the Power BI product is the licensing required to view, publish, and maintain Power BI. However, I believe some of the confusion has settled with Microsoft settling on two basic choices: 1) Power BI Pro License which costs $9.99 per month per user or 2) Power BI Premium which starts at $4,995 per month for dedicated capacity.
Generally a Pro license is designed for smaller, shared capacity situations whereas a Premium license is designed for enterprise level situations including on premises connections and robust connections gateways (How to use the Power BI Enterprise Gateway) and unlimited users. Premium licenses do not require individual user licenses along with allowing for the use of Power BI Report Server, a special version of SSRS which allows Power BI files to be published to a Report Server (Introduction to Power BI Report Server).
Finally, Pro licenses provide a maximum dataset size of 1 GB, a maximum storage capacity of 10 GB per user, and a maximum of 8 automatic refreshes per day. On the contrary, a Premium license provide a maximum dataset size of 10GB, a maximum storage capacity of 100 TB per user, and a maximum of 48 automatic refreshes per day.
Reports vs. Dashboards vs. Visuals vs. APPs
During the design process within Power BI, you must decide what will be shown to the Power BI end users. However, the choice requires some decision making on how to portray your data. The most basic form of displaying data is a visual. Power BI includes both standard and custom visuals (Power BI Desktop Custom Visualization). A standard visual is one provided by Microsoft and includes common charts such as line graphs and bar charts. Custom visuals are designed by both Microsoft and the Power BI community and can include a whole array of different options. Some custom visuals are certified by Microsoft whereas others are not. You do need to be careful to vet any custom visual that is used.
Within Power BI, visuals are placed on a page; within Power BI Desktop these pages are displayed as tabs. Many visuals along with other objects such as text boxes and images can be added to a page; furthermore, one or more tabs or pages make up a report. Along with the related dataset, a report is what is published to a workspace on the Power BI Service (Publish Power BI Report to Power BI Service). Once on the Power BI Service, the reports that are part of a workspace can be published to an APP. APPs are designed to allow the sharing of reports and handle items such as report navigation and access permissions. An APP is considered a cohesive unit for report consumers.
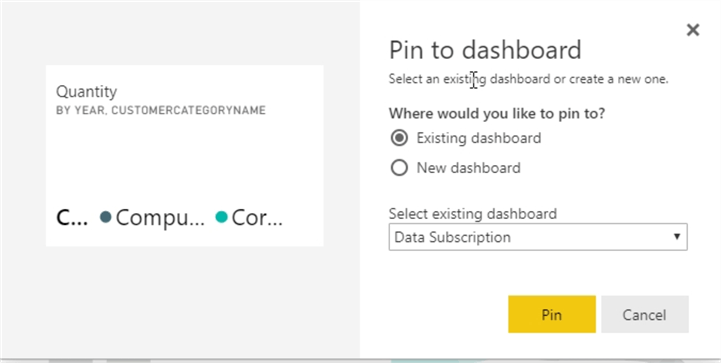
An additional offshoot of a report is the concept of a Dashboard (How to Build your First Power BI Dashboard). Dashboards are a simple way for report consumers to self-customize their own view of group of visuals. Dashboards are created by selecting individual visuals on reports and "pinning" them to a new or existing dashboard. The pinned visuals consider the current state and filters on the visual at the time it was pinned.
DAX vs. M
When beginning the design process in Power BI, you will quickly note that there are two methods / languages that can be utilized to transform data. While "getting" the data for the report, the Power Query Editor is used; this editor allows for querying a significant number of data sources. The Power Query Editor uses a language called M (Simple mathematical formulas using the M Language or Advanced Mathematical Formulas using the M Language). M is the Power Query formula language that acts similar to DAX (see next below); it includes a very large number of functions which again are somewhat similar to DAX or even Excel. M is often used to add or adjust columns within a given data set.
DAX is similar to M in that it works with datasets, but the transformations do not occur in the Power Query Editor, but instead occurs in the report design grid. DAX stands for Data Analysis Expression Language. Again, it is similar to M and makes use of various functions which are somewhat similar to even Excel. Unlike M which is a step by step procedural language which moves line by line starting from the top; DAX expressions are not step by step.
New Column vs. New Measure
This particular dilemma puzzled me for a fairly long time and still at times "catches" me creating the incorrect field. The basic difference between the two is that a column is created at the table level whereas a measure is created at the model level (meaning it can cross between tables).
A measure can be assigned to a home table. Drilling into the reason for selecting a column vs. measure, columns are generally most useful for creating a new field for each row in a table whereas a measure is used to summarize data points. The calculated column is in context of the individual row. Although it may seem like a column could work in most cases, you have to remember that a column must be calculated for each and every row in the dataset; these calculations occur when the data is loaded. For measures, the "calculations" occur in real time; thus, if a filter is applied the measure is recalculated. Based on these differences, you must decide on how to balance load vs. run time performance when either option is available.
Export Data vs. Analyze in Excel vs. Printing
Often you will create a wonderful and beautiful report, APP, or dashboard, and the first thing the report consumer will say is "How can I get this data in Excel?" Or maybe they will say, "How can I print this report?" After a silent scream, there are three available solutions for satisfying these requests.
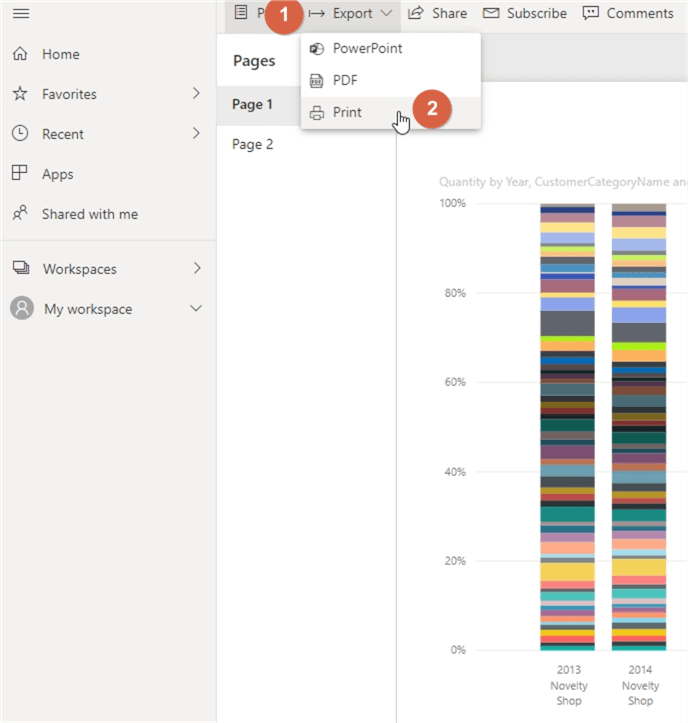
First and probably the easiest option to satisfy the request is printing the report or dashboard. Power BI allows for printing a report by simply selecting the Export option and then then selecting Print (Power BI Templates, Printing and Favorites). Likewise, the export option also allows for a report to be exported to a PDF or Power Point file.
In order to satisfy the need to review the data in Excel, two options exist. The first option is at the visual level. This option allows you to export the data that makes up the selected visual, as illustrated below.

This option allows for exporting either summary level data or full detail level of the data. You should note the 150,000 row limit on data exports.

Finally the third option is to use the Analyze in Excel functionality (Analyzing Power BI data with Excel).
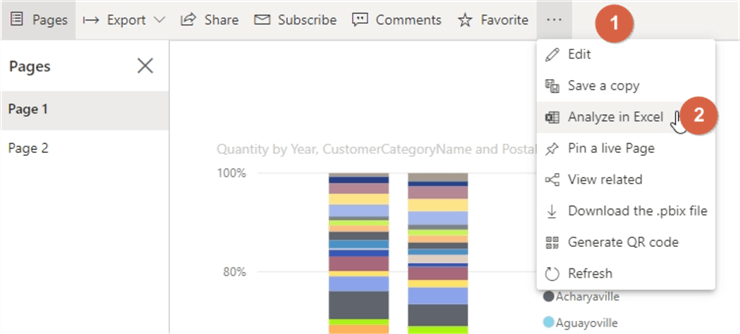
This particular option is really a favorite of mine as it allows for the creating of a data model connection which Excel uses as a back-end connection to the underlying data on the service. This functionality gives users the ultimate control to design their own pivot tables with the data in Excel. This feature, though, is a Pro only, feature.
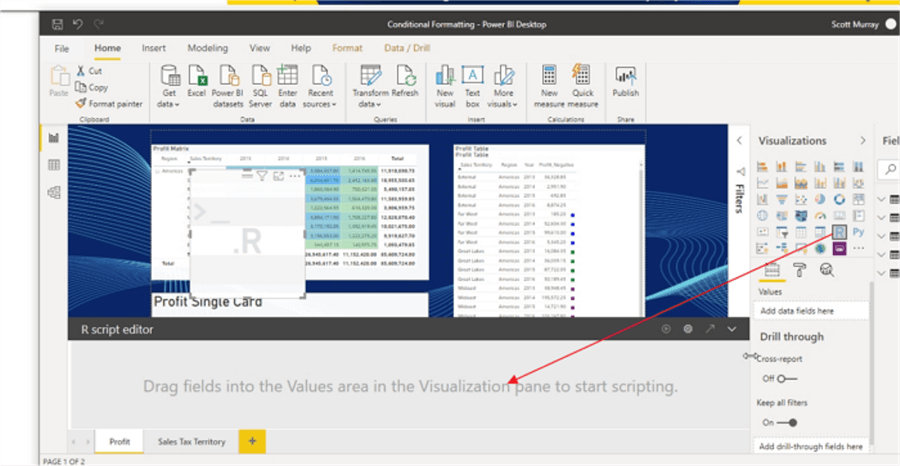
R and Python in Power BI
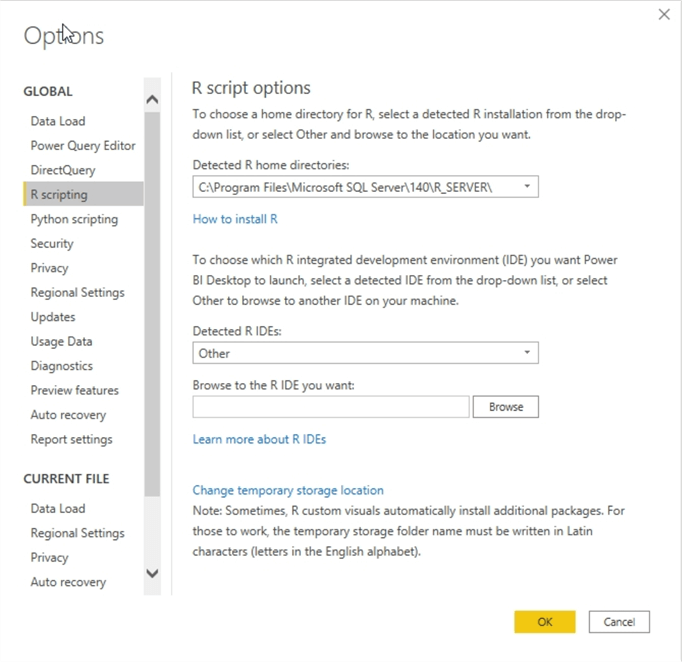
Do you want to use Power BI along with R or Python? Power BI includes support for both R and Python scripting. In order to run an R script, you must set the R Script options as shown below.
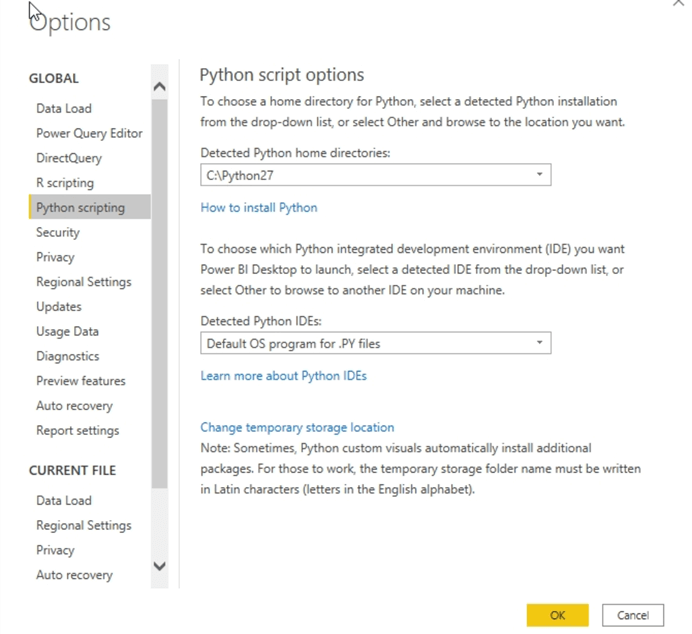
In a similar fashion, the Python script options must also be established.
Once the options are setup, scripting in both languages can easily be executed by entering the appropriate and full script in the scripting box. The resulting data set (data frame) results will be returned to Power BI for use in a visual.

Alternatively, if the results produce a visualization, then that visual can be returned to Power BI.
Conclusion
In this tip we covered some of the various Power BI tips that I wish I knew when I started using Power BI. Each of the items can enhance the arsenal of tools a Power BI report designer needs to be successful.
Next Steps
- All MSSQLTips.com Power BI Development Tips – SQL Server Power BI Tips

I have a passion for crafting Business Intelligence Solutions for my user groups. My experience includes almost 15 years of SQL Server involvement with the last 12 years focused specifically on Business Intelligence, SharePoint, OLAP, SSRS, and Decision Support solutions. Currently, I am a Business Intelligence Architect in the healthcare industry, and I also teach database and analytics classes for Kennesaw State University, Southern New Hampshire University, and Reinhardt University. My education includes an MBA and an undergraduate in Accounting (yes I am a reformed accountant!), both from Kennesaw State University. I enjoy every day by trying to grow my faith and spend precious time with my family. I have been happily married to my wife of over 20 years, and we have two teenagers one who we home school with the help of a University Model School, Cornerstone Prep in Acworth, GA (cornerstoneprep.org). Our other child is a Construction Management major at KSU’s Southern Poly / Marietta campus. We are a soccer and Cross Country (XC) family who play, coach, and referee soccer or run for fun most every day. For several years, our family has volunteered (and played with the dogs and cats) at Etowah Valley Humane Society in Cartersville, GA.
- MSSQLTips Awards: Champion (100+tips) – 2016 | Author of the Year – 2015 | Author Contender – 2014, 2016-2021


