Problem
We have been working more and more with Power BI and the users have asked about how to export data to Excel as well as the ability to analyze data directly within Excel.
Solution
I continue to be amazed at the new items that are getting added to Power BI online. One item that was recently added will definitely make the accountants and financial folks who adore Excel happy. The latest edition of Power BI provides users the ability to export data directly from Power BI to Excel using the Analyze in Excel option. Power BI now creates a fully functional Excel Pivot table with a direct connection to a dataset or report on Power BI. The connections are “live to the dataset”, and require the proper permissions to access. A user must have both permissions to log on to an organization’s Power BI site and also have been assigned access rights to the related dataset. Not only can you create a pivot table, but also pivot charts can be created based on this same connection.
Of course, some caveats do exist when wanting to use this new functionality. First, and somewhat surprisingly, you can work with this tool as long as you have Excel 2010 SP 1 or newer. Additionally, you must install an Excel add-in (which we will review shortly) to incorporate the tool into Excel. Finally, some limited aggregation functions are not available when using these connections, and you must have at least one field defined as a measure in the Power BI dataset.
Finally, this functionality is currently in “Preview mode”” as of the time of the writing of this tip; thus be sure to temper using this feature in production as of yet. I am confident it will become a permanent piece of Power BI at some point, but its final list of features and usage may be different. So let us get started on using this new tool.
Analyze in Excel Power BI Features
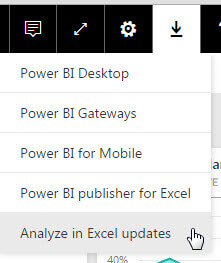
To start using the Analyze in Excel functionality, we must first install the Excel add-in. Two ways exists to complete this process. The first method is to use the download option in Power BI online. In the top right corner of Power BI online, you would click the download tool bar button and then select “Analyze in Excel updates”. This process will download the add-in which you would want to install as you would most other applications (think Next > Next > Next….. and make sure read the terms of service agreement).
Alternately, the add-in can be installed when clicking on Analyze in Excel in a report or dataset option menu. You would first click the ellipse next to the desired dataset and then select Analyze in Excel option. As shown below, a popup will appear which asks if you want to download the Analyze in Excel updates. This message will pop up every time you select the Analyze in Excel option. Once downloaded and installed, you may want to check the “Do not show this again” option in the warning message box. Of course, the install process is the same whether you select option 1 or option 2.


Once you have the add-in installed, you are ready to begin connecting Excel to your Power BI reports and datasets. As shown below, the process can be started either on a dataset or a report.

After clicking on the Analyze in Excel option, Power BI will export a connection file with an ODC file extension. You may recognize the extension as an Office Data Connection which is used to connect to many different data sources. The connection is made to the Power BI site. Depending on the Power BI connection, the connection may actually directly connect to the data source which is in turn used by Excel. The ODC file uses an updated version of the Analysis Service OLEDB driver, which is why you have to install the above mentioned add in.

Upon clicking on the ODC file, Excel will open and will likely display the below security message.

Once you click enable, you must now login to Power BI for your organization.

Finally, you are ready to work with the data in Excel; you can create and edit your pivot tables and charts as you would normally. Notice how the entire field list from the original data set is available to work with on the pivot table.

Additionally, notice that a new tab is added to the Excel Ribbon which is called Power BI and should not be confused with Power Query and Power Pivot which could also be on the ribbon, if installed.

From the Power BI tab, you can do several things. Using the Open Power BI option, opens the Power BI website. If you need to sign out of the Power BI site noted in the current connection, you can use the sign out option here; this process would be useful if you have access to multiple Power BI sites. If an update is available for the Power BI Analyze in Excel add-in, it can be downloaded directly from here using the Update option.

Probably the neatest item in the add-in is the ability to pin your Excel work back to the Power BI site. First, note that this functionality seems to still be a work in progress as only an image is posted back to your Power BI dashboards. I would suspect in future releases that the pinned item will actually be an interactive visualization, as this functionality is built out. The process of pinning is simple; once you click the Pin button in the ribbon, you next select where the item will be placed including which workspace and whether in a new or existing dashboard. As illustrated below, you can see a preview of what will be pinned on the right side of the Pin window. Alternately, you can right mouse click on the pivot table and select the Pin to Power BI dashboard option.


If successful, you will receive the below message which confirms the successful pinning to the noted dashboard.

If you make changes to the pivot table, you can update the changes by pinning the item again. Upon clicking the Pin button again, you get the option, displayed below, to update the tile instead of placing a new one on the dashboard.


In similar fashion, you can pin a Pivot Chart to your online dashboards.

The newly pinned items are now posted onto the selected Dashboard on the Power BI site. As shown in the below screen print, right now the items that were pinned are actually just images.

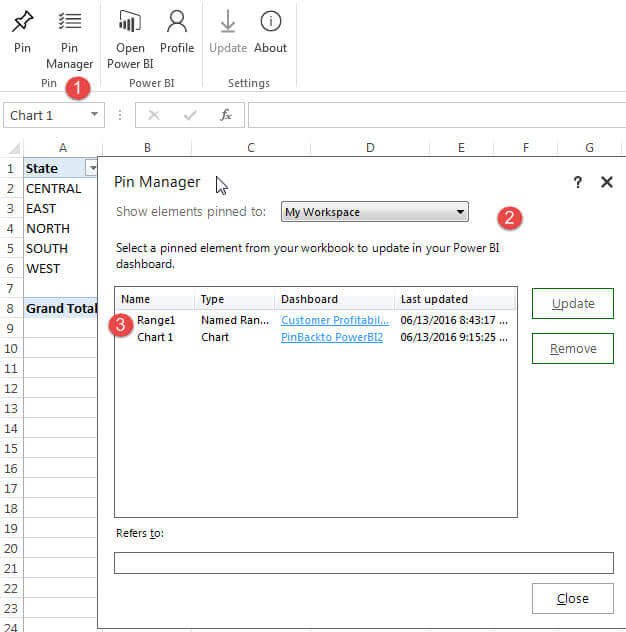
Finally, you can manage your pinned objects by using the Pin Manager. The Pin Manager allows you to update or remove the visualization. The removal only removes the connection, but does not actually remove the visual from the dashboard on the Power BI site.

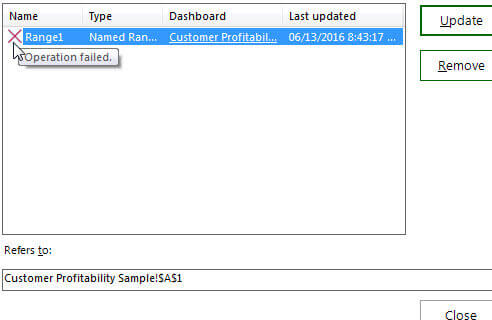
You also may run into instances where an update to the pinned object fails. In the below case, I deleted the dashboard online, and thus the operation to update the pinned object failed as the dashboard no longer exists.
Conclusion
Within Power BI, you can now export your datasets to Excel for further analysis within Pivot tables and charts. The Analyze in Excel option requires the installation of an add-in to Excel and also requires Excel version 2010 SP-1 or later. Once installed, you can initiate the Analyze in Excel option which will create an ODC file. This file contains the connection (and related details) which creates a link to the dataset or report in Power BI. Within Excel, you can drag & drop and work with the data as you would most other Pivot tables. Finally, you can pin (and later manage) the pivot table or pivot chart back to Power BI using the Pin button on the Power BI ribbon.
Next Steps
- Review all the Power BI tips on MSSQLTips.com

I have a passion for crafting Business Intelligence Solutions for my user groups. My experience includes almost 15 years of SQL Server involvement with the last 12 years focused specifically on Business Intelligence, SharePoint, OLAP, SSRS, and Decision Support solutions. Currently, I am a Business Intelligence Architect in the healthcare industry, and I also teach database and analytics classes for Kennesaw State University, Southern New Hampshire University, and Reinhardt University. My education includes an MBA and an undergraduate in Accounting (yes I am a reformed accountant!), both from Kennesaw State University. I enjoy every day by trying to grow my faith and spend precious time with my family. I have been happily married to my wife of over 20 years, and we have two teenagers one who we home school with the help of a University Model School, Cornerstone Prep in Acworth, GA (cornerstoneprep.org). Our other child is a Construction Management major at KSU’s Southern Poly / Marietta campus. We are a soccer and Cross Country (XC) family who play, coach, and referee soccer or run for fun most every day. For several years, our family has volunteered (and played with the dogs and cats) at Etowah Valley Humane Society in Cartersville, GA.
- MSSQLTips Awards: Champion (100+tips) – 2016 | Author of the Year – 2015 | Author Contender – 2014, 2016-2021


I can confirm that I now tested removing the ability to Export Data, as well as “Allow users to use Analyze in Excel with on-premise datasets” and waited 10 minutes.
When I went back in, all the options to Analyze in Excel were removed.