By: Kenneth A. Omorodion | Updated: 2021-02-26 | Comments (11) | Related: > Power BI
Problem
There have been many techniques for creating a Calendar Date table in Power BI using mostly DAX. However, there might be reasons one might want to do the same using Power Query M language which might be for Model Performance reasons or convenience reasons. This post will demonstrate ways I have achieved this using a Custom Column and the M language in Power Query. There are other approaches to doing this as seen in this awesome YouTube video from Enterprise DNA. For those who want to understand the steps on how they can achieve this in a simplified approach that does not require the need to create a lot of query functions that might impact model performance, then continue reading this article.
Solution
To demonstrate this, I have separated the steps as follows:
- Pick your Start Date and enter it in a table column
- Create your End Date using M language function
- Add a column for date ranges between StartDate and EndDate
- Remove the StartDate and EndDate columns and add Other columns
- Load Calendar dates table to Power BI data model
STEP 1: Pick your Start Date and enter it in a table column
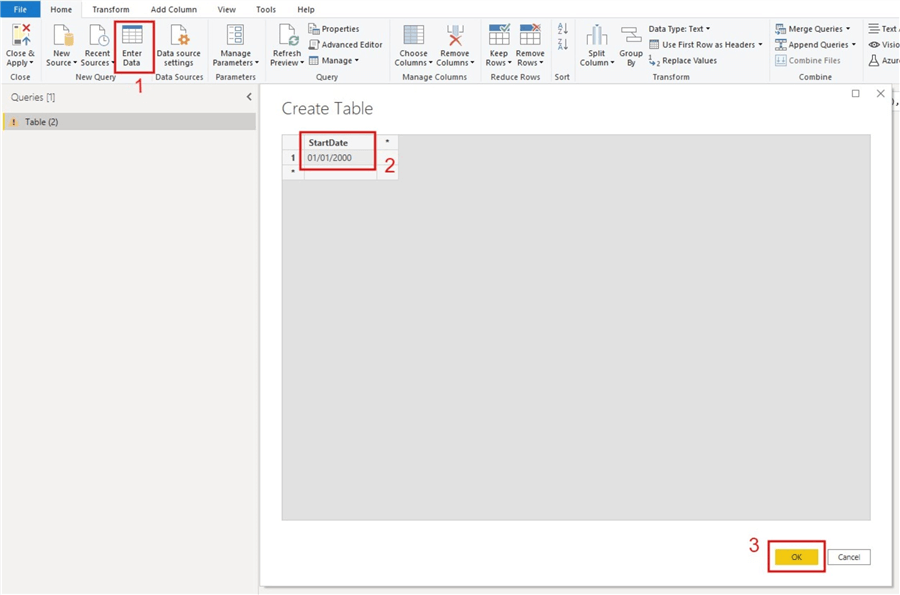
Depending on your business or task requirement, you can choose a date when to start your date range. For instance, if your order date started on January 31, 2010, you might want to enter the start date as "31/01/2010". However, in this post I have used a hardcoded Start Date of "01/01/2000" (with the assumption that at least I am sure that should be within the date range I am going to be working with in my task).
To do this, within a Power Query Editor window in Power BI click on "Enter Data", and when the dialog window opens enter your hardcoded date and name the column as you may wish, but I have named mine "StartDate". See below.
STEP 2: Create your End Date using M language function
Since we should expect the end date to change overtime in any Calendar date table, we could either create the end date to have a far future date like dates into 2025 or we can create a dynamic enddate. The former is not so efficient as it can consume a lot of space in your model and in the long run might impact performance and is not hundred percent future proof.
To setup the Enddate in a dynamic way, we need to use todayís date as the end date (however, this depends on the business requirement). To do this, within the Power Query Editor we click on the "Add Column" tab and then select "Custom Column" as seen in the diagram below. The M Query used here starts with the "Date.From" function, you can read more about this function here. A second function "DateTime.LocalNow()" was used to return today’s date and you can read more about this function on this useful post.
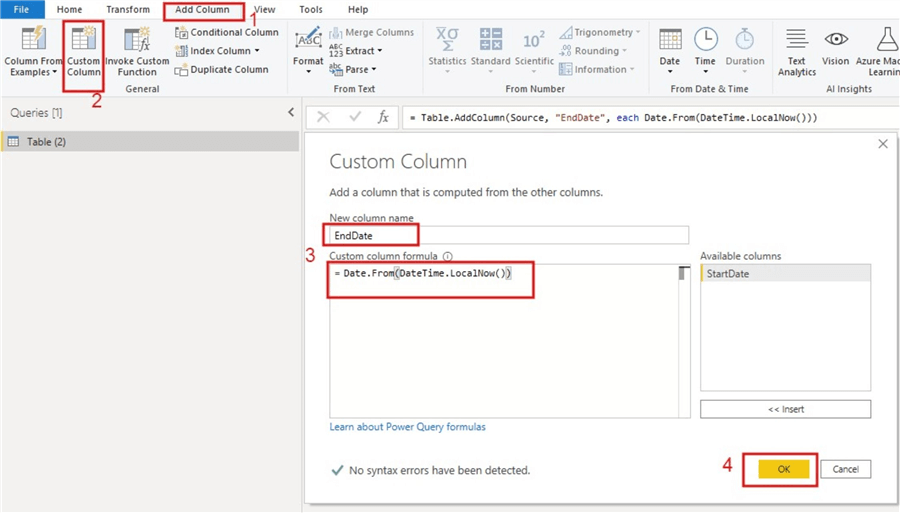
Date.From(DateTime.LocalNow())
Once the M code above is entered correctly you should now be able to see the two columns "StartDate" and "EndDate" as seen in the diagram below. Please remember to change the datatypes of both columns to Date datatypes.

STEP 3: Add a column for date ranges between StartDate and EndDate
Next, we need to add a column to the table that will include date ranges from the StartDate of "01/01/2000" and the EndDate of today.
To do this, once again we need to click on the "Add Column" tab in the Power Query Editor window and select "Custom Column". See the diagram below. Then, we need use the function "Number.From" which will help us convert a date into numbers so that we can get a list of the numbers and later convert the data type of the column into date.
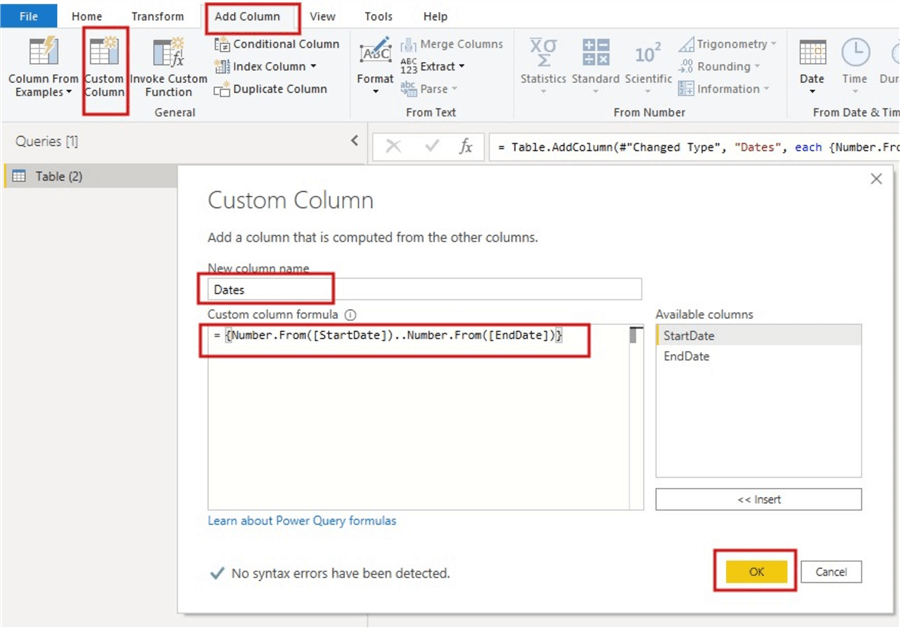
{Number.From([StartDate])..Number.From([EndDate])}
Once the code is entered accurately, you should now be able to see the table as seen in the diagram below. You would need to expand the "Dates" column.

Once the "Date" column has been expanded, you should then be able to see the date range lists, but in numbers, since we converted the dates to numbers using "Number.From" function earlier (remember, dates can be represented in numbers like in Excel). See the diagram below.
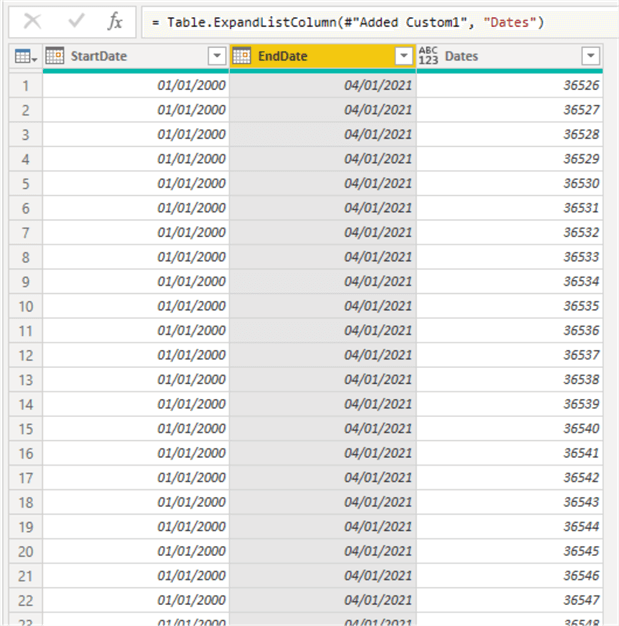
Then, we need to change the data type of the "Dates" column to Date data type so we can better understand the content of the column as seen in the diagram below.
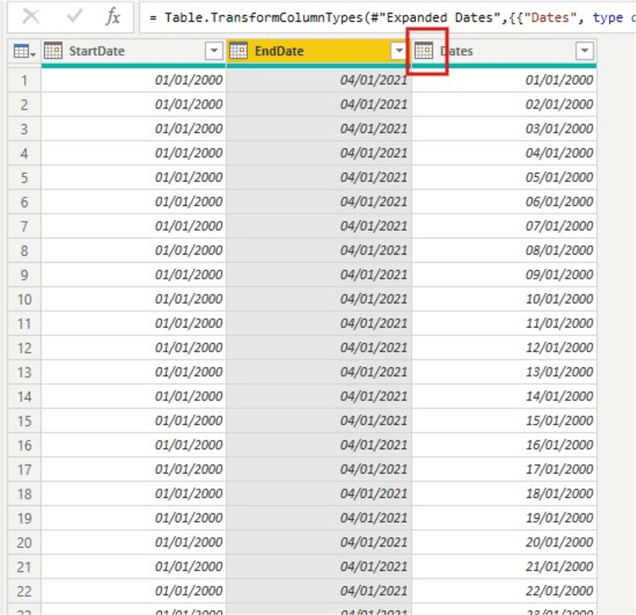
STEP 4: Remove the StartDate and EndDate columns and add Other columns
As you can see from the diagram above, we would not need the StartDate and EndDate columns as they have repetitive values and are not required in what we will be doing going forward. So, we remove both columns as seen in the diagram below.
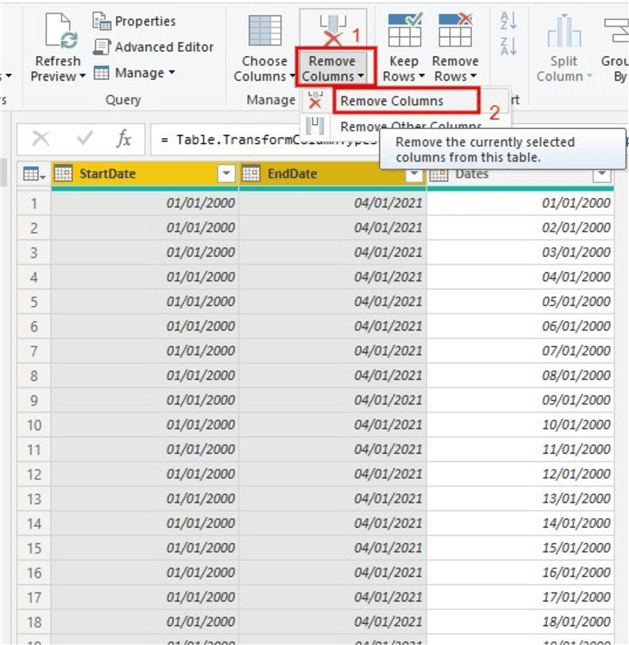
Next, we create a column for "Year" by going to "Add Column" and selecting "Custom Column" as before as seen in diagram below. This is done using the "Date.Year" M Query function. Get more understanding of this function here.
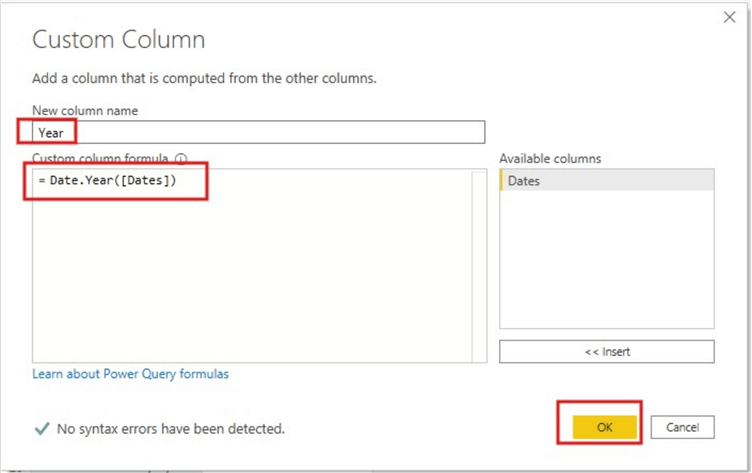
Date.Year([Dates])
Next, we create a "Month", "MonthName" and "ShortMonthName" columns as seen in the diagrams below respectively. For each column we need to use the M Query codes below within the Custom Column window.
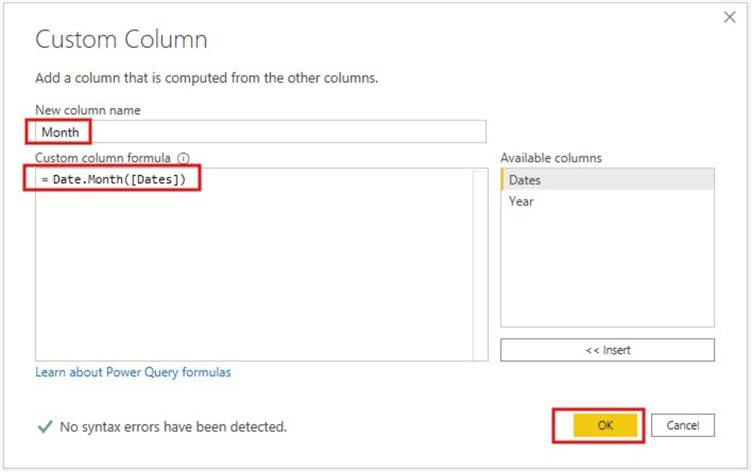
Date.Month([Dates])
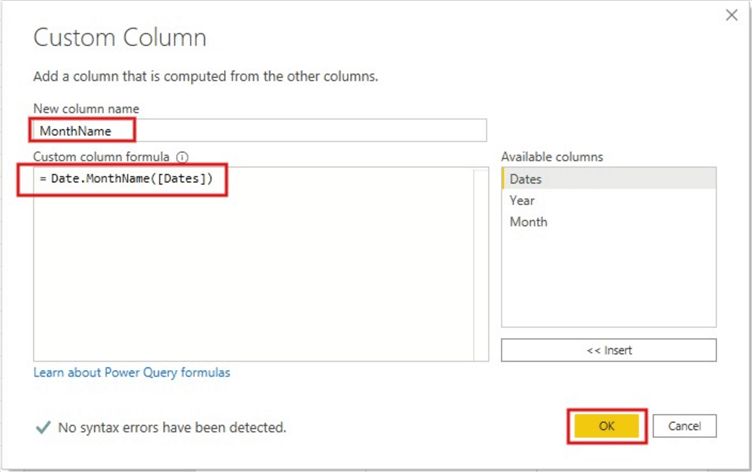
Date.MonthName([Dates])
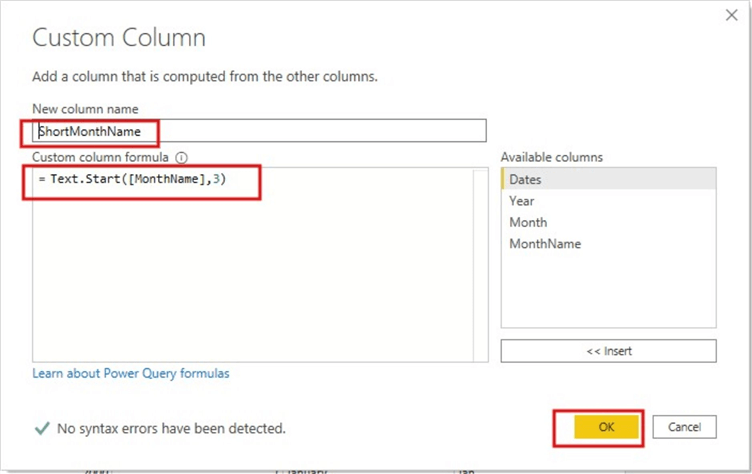
Text.Start([MonthName],3)
Let us add another column for "Quarter" of the year as seen in the diagram below.
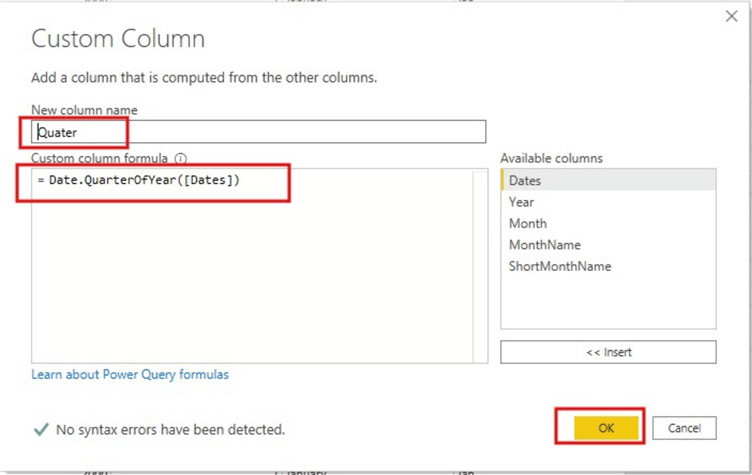
Date.QuarterOfYear([Dates])
So, to add to the "Quarter" of the year column we might like to get values like "Qtr 1", "Qtr 2" etc. To get this we need to adjust the M code above a little bit as seen in the diagram below. Note, please remember to change the data type of the "Quarter" column to "Text" before this step to prevent errors.
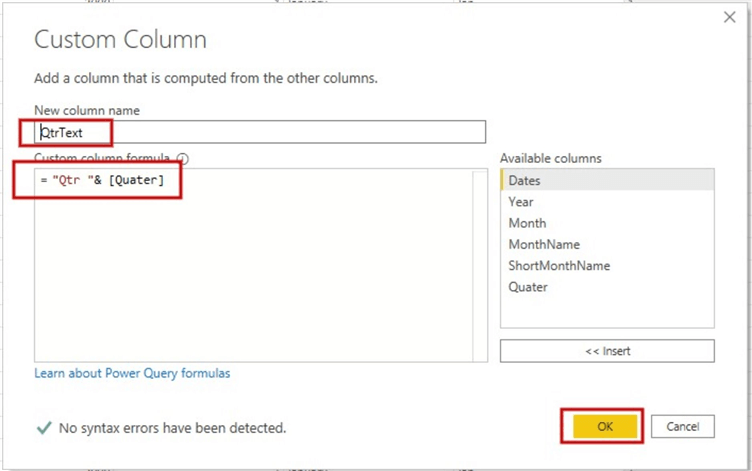
I want to stop there for the purpose of this blog post as I prefer tips that are not too long and complex to read through, I am sure most people are like that too. All we have done can be seen in the diagram below.
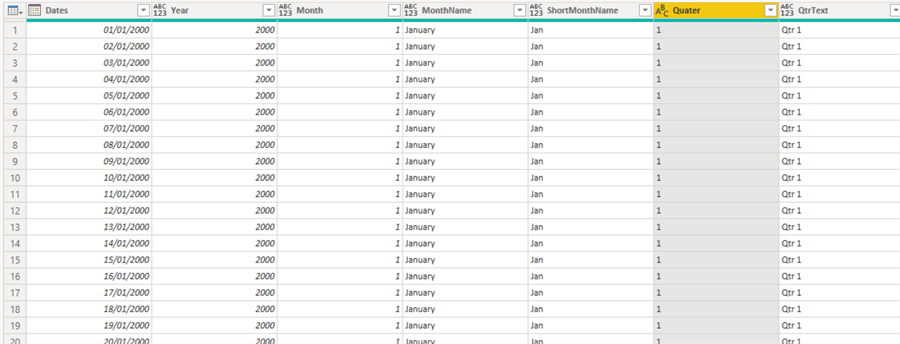
STEP 5: Load Calendar dates table to Power BI data model
Before we load the table to the Power BI Model let us rename the table appropriately to "CalendarTable".
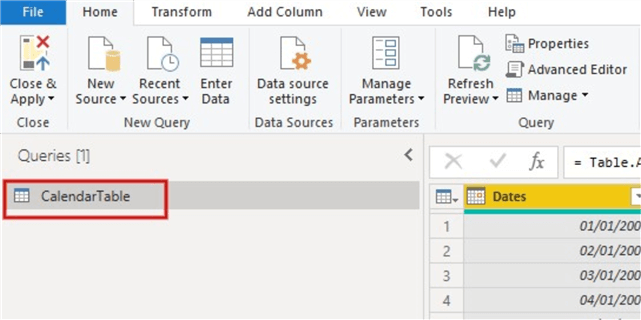
Then we load the table to the model. By now we should be able to open the "Advanced Editor" window to see the full M code behind this Calendar table as seen below.
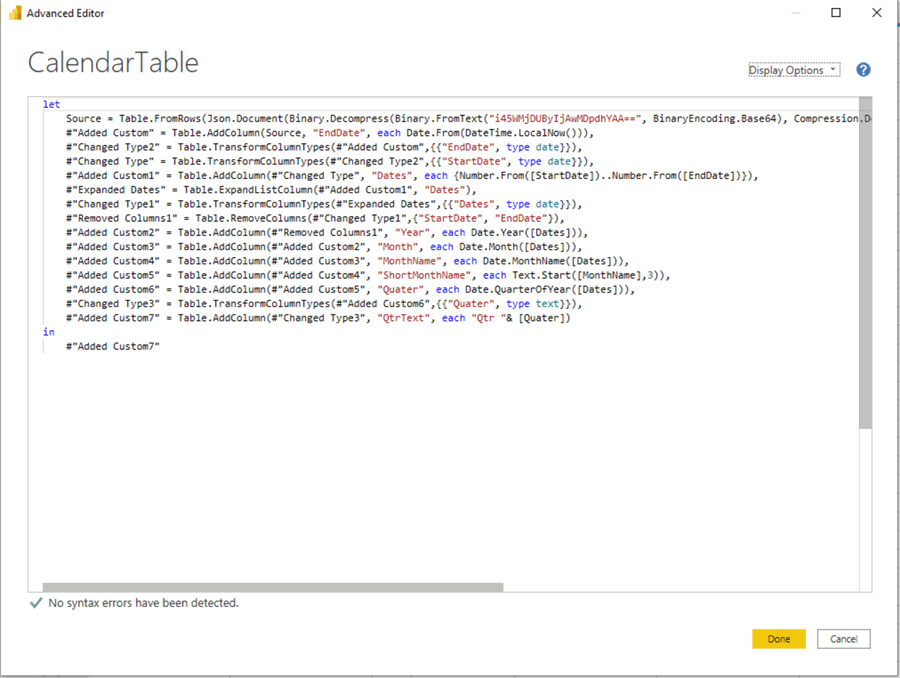
let
    Source = Table.FromRows(Json.Document(Binary.Decompress(Binary.FromText("i45WMjDUByIjAwMDpdhYAA==", BinaryEncoding.Base64), Compression.Deflate)), let _t = ((type nullable text) meta [Serialized.Text = true]) in type table [StartDate = _t]),
    #"Added Custom" = Table.AddColumn(Source, "EndDate", each Date.From(DateTime.LocalNow())),
    #"Changed Type2" = Table.TransformColumnTypes(#"Added Custom",{{"EndDate", type date}}),
    #"Changed Type" = Table.TransformColumnTypes(#"Changed Type2",{{"StartDate", type date}}),
    #"Added Custom1" = Table.AddColumn(#"Changed Type", "Dates", each {Number.From([StartDate])..Number.From([EndDate])}),
    #"Expanded Dates" = Table.ExpandListColumn(#"Added Custom1", "Dates"),
    #"Changed Type1" = Table.TransformColumnTypes(#"Expanded Dates",{{"Dates", type date}}),
    #"Removed Columns1" = Table.RemoveColumns(#"Changed Type1",{"StartDate", "EndDate"}),
    #"Added Custom2" = Table.AddColumn(#"Removed Columns1", "Year", each Date.Year([Dates])),
    #"Added Custom3" = Table.AddColumn(#"Added Custom2", "Month", each Date.Month([Dates])),
    #"Added Custom4" = Table.AddColumn(#"Added Custom3", "MonthName", each Date.MonthName([Dates])),
    #"Added Custom5" = Table.AddColumn(#"Added Custom4", "ShortMonthName", each Text.Start([MonthName],3)),
    #"Added Custom6" = Table.AddColumn(#"Added Custom5", "Quarter", each Date.QuarterOfYear([Dates])),
    #"Changed Type3" = Table.TransformColumnTypes(#"Added Custom6",{{"Quarter", type text}}),
    #"Added Custom7" = Table.AddColumn(#"Changed Type3", "QtrText", each "Qtr "& [Quarter])
in
    #"Added Custom7"
You can then reuse the M code in another Power BI report where applicable, and you can add more columns to the table as the business requires, for example, you might want to add "Year-Month", or "WeekNumber", or "DayName", or "Day" columns. All these would then be reflected in the summary M code within the Advanced Editor.
Next Steps
- Check out these additional resources:
- See this YouTube video from Ruth of Curbal on creating list of dates in Power Query here.
- You can get more detailed documentations on M Query Language from Microsoft here.
- Check out these series of blog posts by Jaykilleen on Power Query here.
- Also, checkout this helpful YouTube video on M Query training by Ruth of Curbal here.
- Try this tip out in your own data as business requires.
Learn more about Power BI in this 3 hour training course.
About the author
 Kenneth A. Omorodion is a Business Intelligence Developer with over eight years of experience. He holds both a bachelorís and masterís degree (Middlesex University in London). Kenneth has the MCSA, Microsoft Data Analyst - Power BI and Azure Fundamentals certifications. Kenneth is a Microsoft Certified Trainer and has delivered corporate training on Power BI, SQL Server, Excel and SSRS.
This author pledges the content of this article is based on professional experience and not AI generated.
View all my tips
Article Last Updated: 2021-02-26


