Problem
In this article, I’m going to discuss how to create a conditional column in Power BI. A conditional column is just another column that is generated based on a condition imposed on an existing column. A simple use case would be to categorize users as Child or Adult based on age.
Solution
In this tip, I’m going to create a Power BI report that will fetch some demo user data from a CSV file. The CSV file has only two columns – Name and Age. After importing this data into Power BI, we will categorize the users as Adult or Child based on the age. If the age of the user is greater or equal to 18, then he/she should be categorized as an adult otherwise as a child.
Importing Data into Power BI
The first step to begin with is to import the data into the Power BI environment. To do this I’ll follow the steps below.
- Click on Get Data from the ribbon bar in Power BI Desktop.
- The Get Data dialog appears.
Select Text/CSV under Files and click Connect.

Browse the location of the CSV file and click OK.
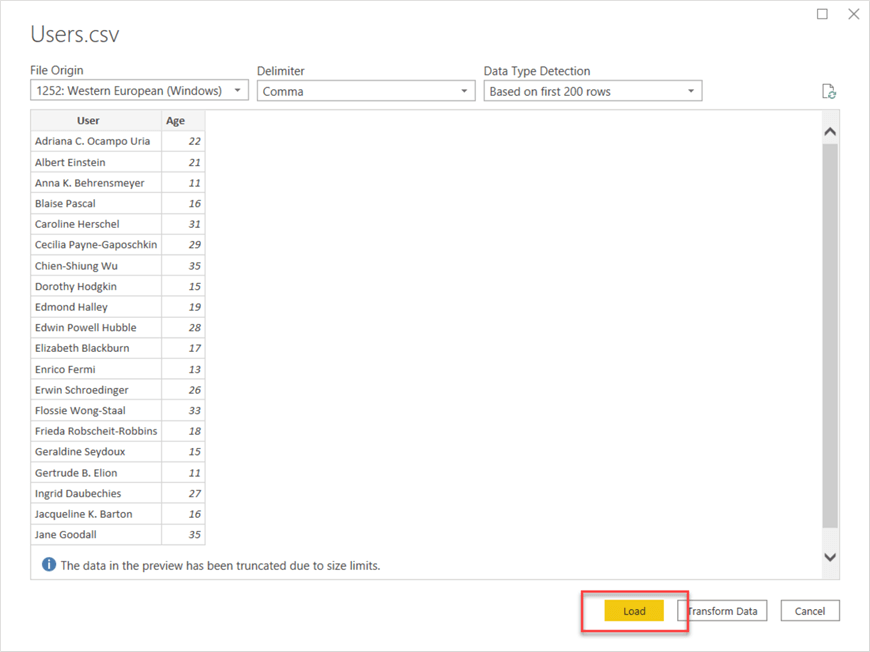
The preview of the data to be loaded appears. Click Load.
Adding Conditional Column to Power BI
Once the source data is fetched into Power BI, the next step is to go ahead and create the conditional column that we have discussed earlier. I’ll follow the steps below to create the conditional column.
Click on the Edit Queries from the ribbon on the top. The Power Query Editor window appears.
Select Add Column on the menu bar and select Conditional Column. The Add Conditional Column dialog appears.

Enter the New Column Name as “Category“.
From the Column Name dropdown, select Age (since our conditional column is based on Age).
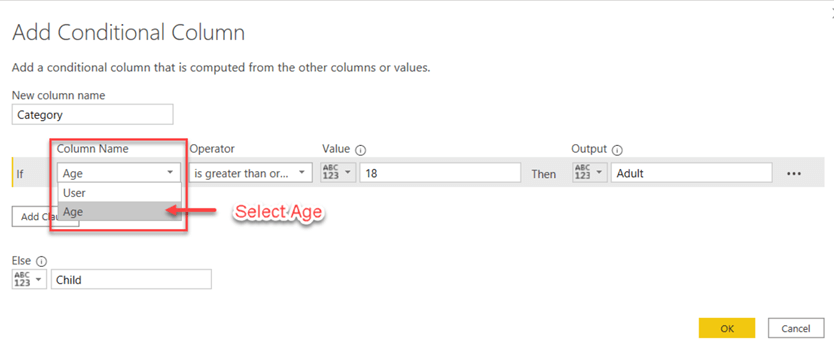
From the Operator dropdown, select “is greater than or equal to”.

Now, enter values as “18“, “Adult” and “Child” for the fields Value, Output and Else respectively and click OK.

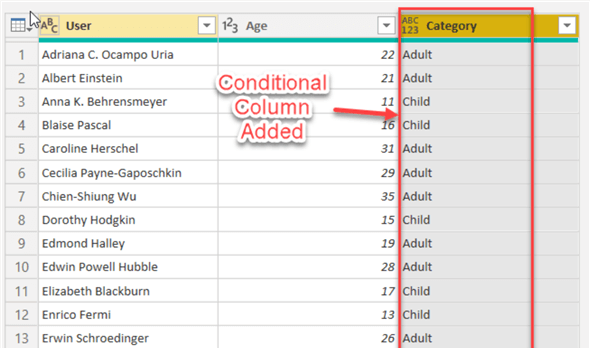
Notice that the new column Category has been added to the dataset. We also have values (Adult/Child) in this column based on the age of the users.
Creating Power BI Chart Using Conditional Column
Once we have the conditional column ready in Power Query Editor, we can easily create visualizations using this new column. Let’s analyze the Users count by Category.
Select Pie Chart from the visualizations. Drag and drop Category to Legend and Users to Values.
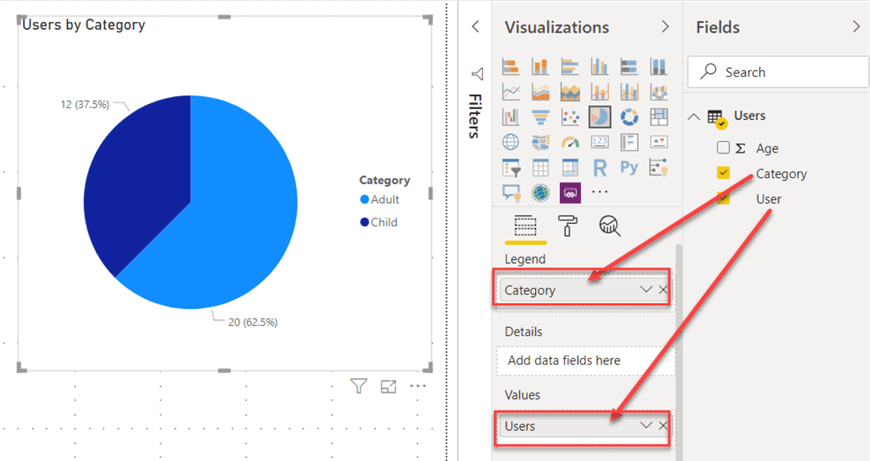
From the pie chart, we can infer that more than 60% of the users are adults while the rest are children.
Next Steps
- Read more about creating conditional columns in Power Query.
- Check out all of the Power BI tips on MSSQLTips.com.

Aveek Das is an experienced Business Intelligence and Data Analytics professional with over four years of expertise in the Microsoft SQL Server BI stack along with Power BI, Qlik and Tableau. He helps clients uncover insights from their own data and recommends actionable items. He has successfully done projects in various sectors, such as retail, insurance, leisure, and RSA.
Aveek likes to work on projects using tools from the Microsoft Data Platform and Azure. He takes on projects that cover the entire life cycle of a business intelligence project: Master Data Management, ETL architecture and development, design and development of the Data Warehouse, development of an OLAP data model (Analysis Services Multidimensional/Tabular), and finally designing the front-end presentation layer in Power BI, Qlik Sense or Tableau. For designing data warehouses, Aveek is well versed in the Kimball methodology, however, he also has a background on Data Vault and Data Lakes. He has worked with different versions of SQL Server, from 2008 to 2016 and Azure SQL Database and DataWarehouse.
In addition to this, Aveek is also working on a personal project, which uses Natural Language from customers to answer questions about their data, thus providing insights using a virtual assistant. This project relies on the Microsoft Bot Framework coupled with Cognitive Services as a utility in addition to the Microsoft BI Stack to interact with customers using various channels, such as Slack, Skype, etc. and deliver information right away.
Over the years, Aveek has developed expertise using the following tools:
- Integration Services (SSIS)
- Analysis Services (SSAS Multidimensional and Tabular); also, well versed in writing MDX and DAX queries.
- Reporting Services (SSRS, DevExpress); can deliver both paginated as well as mobile reports using Datazen.
- Data Visualization (Power BI, Qlik Sense, QlikView, Tableau)
- Data Analytics using R (Forecasting, Sales Trend, Customer Churn, Market Basket)
Data Visualization is one of his keen interests as he believes it is one of the key factors for a successful BI project because visualization becomes the face of the entire BI architecture for the end customers. He has conducted several webinars and presentations and delivered training on Data Visualization tools and techniques.


