Problem
Often when you speak with a DBA about grouping items into specific sets or binning data into certain groups, they will say, “Do it in the presentation layer” and not in your query. Power BI is definitely a great presentation layer, and it contains grouping and binning functionality to support just these sort of requests. The functionality can get a bit tricky when you begin to add multiple dimensions upon which to sort. In this tip we will cover both of these functions. Read this tip to learn more.
Solution
You may be wondering what the difference is between grouping and binning is? That is a great question; with grouping you are normally working with dimensional attributes whereas binning is generally grouping measure or numeric values into segmented buckets. Binning also gives you the opportunity to merge a numeric dimension into a predefined or rolled up group of values, often automatically. So, let us get started with some fine examples that utilize grouping and binning.
To get started with Power BI and Power BI Desktop, you need to do a few things to get everything setup for access. First, you need to go to the Power BI web site and sign up to access Power BI. Note that you must use a work or school address to sign up for Power BI. Next, you need to download the Power BI Desktop (PBID) tool. Once you have your account setup and your Power BI Desktop application installed, you are ready to start working with Power BI!
Grouping in Power BI
Let us get started by implementing a group. We are using the Wide World Importers databases, which is freely available from Microsoft, as the basis for our data. We will not go into all the details here ( feel free to review both this tip, Querying SQL Server Data with Power BI Desktop, and this tip, Power BI Data Import and Export with Excel, for details on retrieving data from a SQL Server or Excel dataset), but our first step is to load the Dimension Customer and Sales.CustomerTransaction tables using the Get Data functionality. We will use these tables as the source for our visualizations.
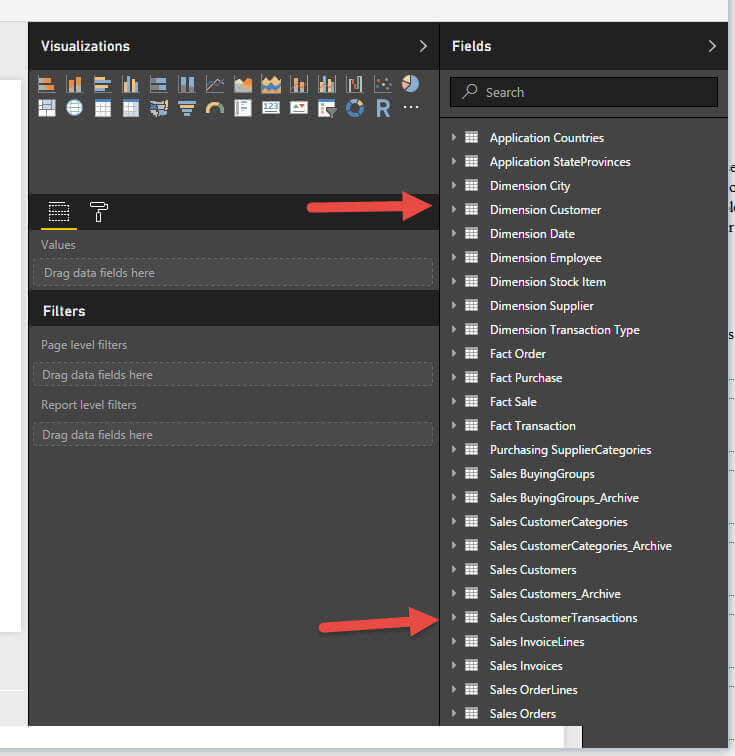
Next, we will create a simple visual with Customer, Transaction Amount, and Tax Amount.

In the above screen print, you can quickly see the dilemma with the above list of customers; the Wingtip Toys Customer and TailSpin Toys Customer are broken out by individual stores; plus there is a large unknown customer list. This situation is the perfect reason to create a group. We will actually want to create two groups, one for Wingtip Toys and one for TailSpin Toys. To begin grouping, you would want to right click on the customer attribute in the Dim Customer dimension table and then select New Group. Alternatively, you can click on the three dot ellipse button next to the field, or you can click the down arrow next to the field in the values area.

The Groups Window opens and we must complete the following:
- Name of the new attribute that will reflect the groups. Note, this name is not the name of the individual groups, but actually the name of the field that will be created for the groups.
- Select the values to be included in our group
- Click the Group button as we complete each group
- Decide if we want an “Other” Group
- Finally click “OK” when all groups are setup
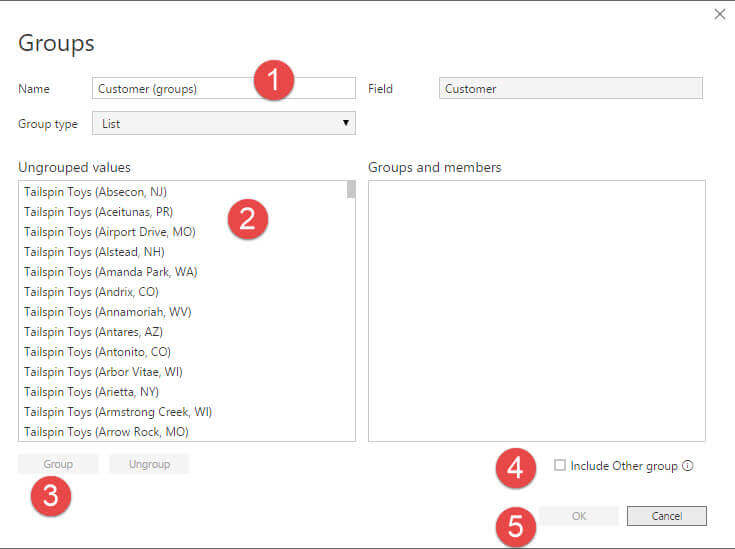
Thus, each value for Tailspin Toys is selected and then the group button is selected.

Now we have our first group which includes all the TailSpin Toys customers.

Next, we group all the Wingtip Toys customers and also select the include Other group option. If this option is not selected, then all the values that are not in the groups are individually listed.

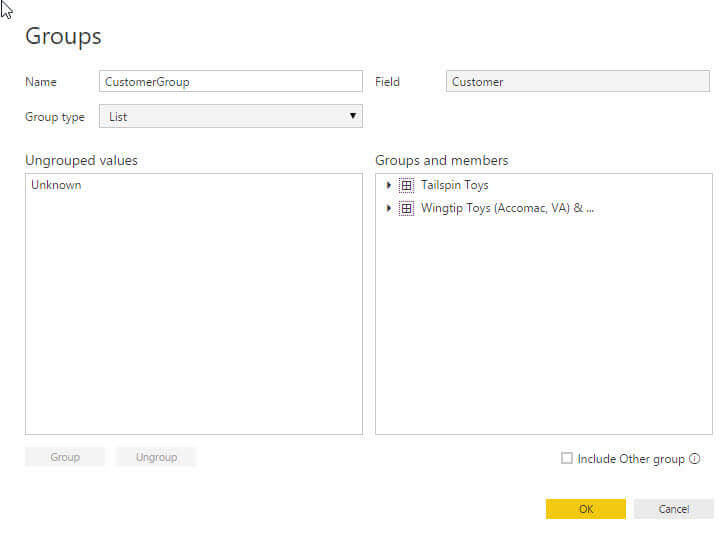
Finally, we click ok and our group is created; additionally, you will also notice that a new dimension attribute is created, called CustomerGroup. We can bring that group onto our visual, as shown below, and this attribute then acts as any other dimension field.

If we uncheck the include Other group, then any values not in our groups are listed individually, as shown below (Unknown is our only customer not grouped).

Finally, you may want to edit your groups. You can, as shown next, right click on the group or click on the ellipse next to the group field, and select Edit Groups.

While editing the group, you may have noticed that the default names for the groups may not always be appropriate; they are actually set to the first value in the list group. However, if you double click on the group name (not the name field, but the actual individual group name), you can rename it. As shown below, I am highlighting “(Absecon, NJ) & …”.

Once I delete this text, we now have a more appropriate individual group name.
Binning in Power BI
Setting up Bins works in a fashion very similar to groups except the grouping only works on numeric, date, or equivalent type fields. The initial process is the same as for grouping, except after clicking the New group options, we are presented with a different grouping screen, as shown below. We still need to name our new Bin Group, but group type is now set to Bin; we can change this back to list if desired. Thus, in the below example, we are splitting the InvoiceID field in bins of 1000; that means that we will group the InvoiceID into groups of 1000 invoices.

Thus, we now have a new attribute called InvoiceID (bins), which we can drop onto our visualization as shown below. For our InvoiceID example, we have over 70,000 invoices, but using Bins reduces the number of data points to just 70.

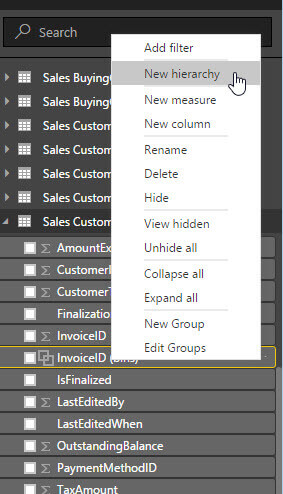
If you want to make the new bin more useful and allow for drill down, we can now make a new hierarchy with the Bin field and our original Invoice ID field. To complete this task, we would first right click (or click the ellipse next to) our Bin field and select New hierarchy. Next, we would click on the base InvoiceID field, click Add to Hierarchy, and then select the InvoiceID (bins) Hierarchy.

Now we have a hierarchy that we can place on our cross tab visual.

Now by dragging the hierarchy onto the visualization we can see the levels of the bin, as shown in the below illustration. I know what you are thinking, “Are we able to collapse the hierarchy. Unfortunately, not as of yet, but it is supposed to be on the Power BI road map! Hopefully soon.

Of course, we can use these same groupings on most of the other visuals available in Power BI, just by selecting a new visual from the Visualizations Gallery.

Conclusion
Grouping and binning enhance the visual appeal of Power Bi Desktop / Online; this functionality allows you to allocate data values to specific groups for more distinct reporting. The grouping function provides the ability to hand pick which values go into which group, whereas the bin function requires you to pick the group size and then Power BI allocates each data point to a bin automatically. Binning, however only works with numeric or date data types. In either case, a new attribute or field is created and can be used just like any other field in your data sets.
Next Steps
- Read these related tips:

I have a passion for crafting Business Intelligence Solutions for my user groups. My experience includes almost 15 years of SQL Server involvement with the last 12 years focused specifically on Business Intelligence, SharePoint, OLAP, SSRS, and Decision Support solutions. Currently, I am a Business Intelligence Architect in the healthcare industry, and I also teach database and analytics classes for Kennesaw State University, Southern New Hampshire University, and Reinhardt University. My education includes an MBA and an undergraduate in Accounting (yes I am a reformed accountant!), both from Kennesaw State University. I enjoy every day by trying to grow my faith and spend precious time with my family. I have been happily married to my wife of over 20 years, and we have two teenagers one who we home school with the help of a University Model School, Cornerstone Prep in Acworth, GA (cornerstoneprep.org). Our other child is a Construction Management major at KSU’s Southern Poly / Marietta campus. We are a soccer and Cross Country (XC) family who play, coach, and referee soccer or run for fun most every day. For several years, our family has volunteered (and played with the dogs and cats) at Etowah Valley Humane Society in Cartersville, GA.
- MSSQLTips Awards: Champion (100+tips) – 2016 | Author of the Year – 2015 | Author Contender – 2014, 2016-2021


