Problem
I have found this topic quite popular among Power BI users and developers. They want to know how to create dynamic tables in Power BI using DAX, as they could with other programming and query languages.
While DAX is often recognized for its prowess in calculations and measures, it also has the remarkable ability to create tables dynamically. This facet of DAX opens a world of possibilities, empowering you to shape and mold your data to answer specific questions and uncover hidden patterns.
In this article, I will dive into the DAX functions that empower you to create tables dynamically within your model in various scenarios.
Solution
Throughout this tip, I will use the AdventureWorks database and data warehouse to illustrate how to create dynamic tables using DAX functions. To learn more about the sample database used in this demo, please refer to this article: AdventureWorks sample databases.
Many functions in DAX can be used to create tables dynamically based on the business need. I will mention and illustrate 10 of the most popular functions for this article.
To create a dynamic table in Power BI, you need to first click on the Modeling tab and then select “New table” in the ribbon within the “Calculations” section, as shown in the image below.

ADDCOLUMNS DAX Function
This DAX function is used when existing tables need to be expanded with new columns. For example, imagine expanding your FactInternetSales table with a “Profit Margin” column, calculated as Profit divided by Sales, and a “Year-to-Date-Sales” column. ADD COLUMNS allows you to conjure this new dimension, enriching your analysis.
The DAX code below uses the ADDCOLUMNS function to create a new dynamic table with two additional columns as defined in the code (the “Profit Margin” and “Year-to-Date-Sales” columns). All you need to do is define the table you want to add the columns to as a new table, then give the columns a name in quotes (you can add columns as you wish), and define the expressions (calculations) for the columns you have given the name.
USING ADDCOLUMNS =
ADDCOLUMNS (
    FactInternetSales,
    "Profit Margin", [TotalProductCost] / [SalesAmount],
    "Year-to-Date Sales",
        CALCULATE (
            SUM ( FactInternetSales[SalesAmount] ),
            DATESYTD ( DimDate[FullDateAlternateKey] )
        )
)
You can read more about the DAX ADDCOLUMNS function, including its syntax definition and limitations: ADDCOLUMNS.
CROSSJOIN DAX Function
This function generates a table representing all possible combinations of rows from two or more tables (a Cartesian product). It is useful for scenario analysis and testing assumptions. For example, you can use CROSSJOIN to explore every conceivable customer-product pairing.
The DAX code below shows how to use the CROSSJOIN function to generate a dynamic table.
USING CROSSJOIN =
CROSSJOIN(
    DimCustomer,
    DimProduct
)
Try using this function when you have small datasets, as it could lead to performance issues since it increases the size of your model due to the Cartesian product. You can read more about the CROSSJOIN function: CROSSJOIN.
VALUES DAX Function
The VALUES function returns a dynamic table with a single column of distinct values from a specified column. It’s especially useful for creating lists and filtering. For example, where you want a list of distinct occupations of your customers, the VALUES function sifts through the rows, returning a table showcasing each occupation once, ready for filtering or further exploration.
The DAX code and image below show a sample of how to achieve this.
USING VALUES =
VALUES ( DimCustomer[EnglishOccupation] )
Read more about this function’s limitations, considerations, and other use cases: VALUES.
SUMMARIZE DAX Function
This function creates dynamic tables by summarizing values and making the tables from the aggregations. It is the cornerstone for creating summary and pivot tables in DAX. For example, if you need to create a table to summarize the sales by country, the SUMMARIZE function groups your Sales data by Country, then calculates total sales for each, and the output is a summarized table.
Here is an example of this DAX code:
USING SUMMERIZE =
SUMMARIZE(
    FactInternetSales,
    DimGeography[EnglishCountryRegionName],
    "Total Sales", SUM(FactInternetSales[SalesAmount]),
    "Average Order Size", AVERAGE(FactInternetSales[OrderQuantity])
)
As shown in the DAX code and image above, the syntax is similar to the ADDCOLUMNS function, but the difference is obvious. The ADDCOLUMNS function creates a new table with all existing columns in the original table as well as the newly created columns; the SUMMARIZE function creates a new table with aggregated values as defined in the DAX code (i.e., “Total Sales” and “Average Order Size”). Thus, the table is far smaller in size.
GENERATE DAX Function
The GENERATE function generates rows based on expressions or specified conditions. It is particularly powerful when you need custom tables and testing scenarios.
It also returns a Cartesian product output. However, it does this in a slightly different way than the CROSSJOIN. The GENERATE function has two table arguments. It creates a table with the Cartesian product between each row in the first table and the results of the evaluation of the second table based on the context of the current row from the first table.
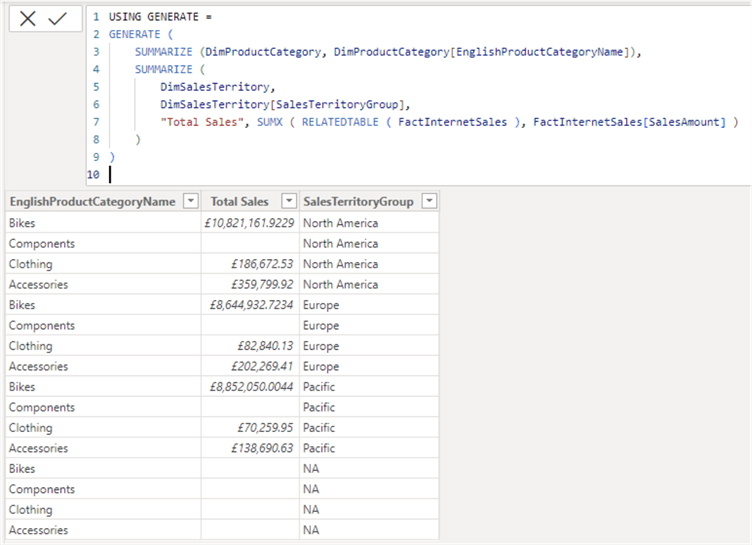
Here’s an example when you want to return a table of “Total Sales” by “Region Groups” and “Product Category” for Internet Sales. The following code and image show how to achieve that.
USING GENERATE =
GENERATE (
    SUMMARIZE ( DimSalesTerritory, DimSalesTerritory[SalesTerritoryGroup] ),
    SUMMARIZE (
        DimProductCategory,
        DimProductCategory[EnglishProductCategoryName],
        "Total Sales", SUMX ( RELATEDTABLE ( FactInternetSales ), FactInternetSales[SalesAmount] )
    )
)
As you can see, the DAX code above uses the SUMMARIZE function to return each “Sales Territory” and “Product Category” in separate rows in the table. Also, note that the second SUMMARIZE function does more by generating a table of each Product Category along with its associated Total Sales values.
Note: If you generate this table by evaluating it under the context of returning each row based on Sales Territory instead of Product Category (more like what column to group the “Total Sales” by), the output would be different (but still factual) as seen in the image below.
USING GENERATE =
GENERATE (
    SUMMARIZE (DimProductCategory, DimProductCategory[EnglishProductCategoryName]),
    SUMMARIZE (
        DimSalesTerritory,
        DimSalesTerritory[SalesTerritoryGroup],
        "Total Sales", SUMX ( RELATEDTABLE ( FactInternetSales ), FactInternetSales[SalesAmount] )
    )
)
CALENDAR / CALENDARAUTO DAX Function
These DAX functions are required for creating dynamic date tables in Power BI. These tables are invaluable for time-based analysis. As you may already know, to have a proper model in Power BI, a date dimension table is very important; thus, if this date dimension table is not already available, you need to create one dynamically. That’s where these DAX functions come in.
Both would create a dynamic dates table for you, but they do so in a slightly different way. For instance, the CALENDAR function has two mandatory arguments in its syntax, requiring a start date and an end date to be specified. In contrast, the CALENDARAUTO function only has a single optional argument in its syntax. Whichever of the two you use, you may need to add more columns to the table later using some of the functions we have already described. See the DAX codes example and images below that demonstrate these.
USING CALENDAR =
CALENDAR(DATE(2024, 01, 01), TODAY())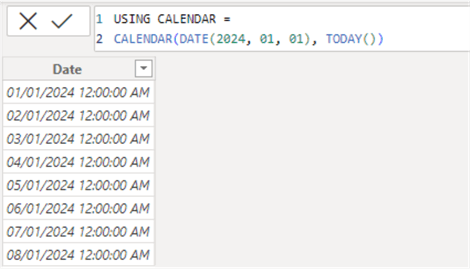
USING CALENDARAUTO =
CALENDARAUTO()
You can also include the optional “Fiscal Year End Month” in the bracket, as seen below. In the example below, I have entered “05” or “5,” indicating that my fiscal year (or financial year) starts in May and ends in April each year.
USING CALENDARAUTO =
CALENDARAUTO(04)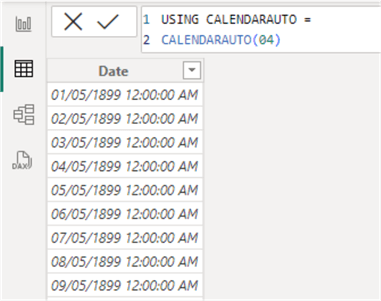
FILTER DAX Function
Based on specified criteria, this DAX function returns a filtered subset of a table. For example, suppose you want to only retrieve high-value sales from the FactInternet Sales table (i.e., where SalesAmount is greater than 2000, for instance). In that case, the FILTER function can be used to carve out a subset of the table by retaining only rows that meet the defined criteria where the Sales Amount exceeds a particular threshold.
The FILTER function can be used to reduce the number of rows in a table you are working with by only returning a subset of the table based on the filter condition provided.
The DAX code and image below illustrate how you can achieve this.
USING FILTER =
FILTER(FactInternetSales, [SalesAmount] > 2000)
TOPN DAX Function
This DAX function returns a table containing the top N rows based on a specified expression. For example, if you need to return a table with the top 10 products by total sales, and you need this to be returned as a table, then you can use this function.
See more details on the DAX TOPN function in the Microsoft documentation.
USING TOPN =
TOPN(10, DimProduct, [TotalSales], DESC)
UNION DAX Function
The DAX UNION function acts like that of SQL in that it combines two tables with identical structures while appending rows. For instance, if you have two tables holding customer data from different sources, the UNION function can help to join both tables seamlessly, creating a unified, comprehensive view of your customers as long as the two tables have the same structure. You could also be creative in using this function by leveraging the ideas we have used in earlier functions to pull a column from one table and combine it with another column from another table to form a table with a single column of distinct values (duplicates removed).
Let’s see an example of using the DAX UNION function to achieve the second example using AdventureWorks tables, as seen below.
USING UNION =
DISTINCT (
    UNION (
        VALUES ( DimCustomer[CustomerKey] ),
        VALUES ( FactInternetSales[CustomerKey] )
    )
)
NATURALINNERJOIN / NATURALLEFTOUTERJOIN DAX Function
These functions create joined tables based on common column names. They are useful when you need to merge related data sets. Both functions work like the INNER JOIN and LEFT JOIN in SQL, respectively.
Without going into much detail, I will demonstrate the DAX NATURALINNERJOIN with an example where I need to merge the Sales table with the Customers table. This will produce a table with matching values in both tables, CustomerKey as the join column as seen in the DAX code below.
USING NATURALINNERJOIN =
NATURALINNERJOIN (
    SELECTCOLUMNS (
        DimCustomer,
        "CustomerKey", CONVERT ( DimCustomer[CustomerKey], INTEGER ),
        DimCustomer[FirstName],
        DimCustomer[LastName]
    ),
    SELECTCOLUMNS (
        FactInternetSales,
        "CustomerKey", CONVERT ( FactInternetSales[CustomerKey], INTEGER ),
        FactInternetSales[SalesAmount],
        FactInternetSales[OrderDate]
    )
)
Here is an example of DAX NATURALLEFTOUTERJOIN, where I need to list all products in my DimProduct table, and only matching values from the FactInternetSales table (LEFT JOIN). See the DAX code and image below showing ProductKey and EnglishProductName from the DimProduct table and observe that only where there is an order for the products in the FactInternetSales table. There was an OrderDate and CustomerKey returned; otherwise, it is blank.
USING NATURALLEFTOUTERJOIN =
NATURALLEFTOUTERJOIN (
    SELECTCOLUMNS (
        DimProduct,
        "ProductKey", CONVERT ( DimProduct[ProductKey], INTEGER ),
        DimProduct[EnglishProductName]
    ),
    SELECTCOLUMNS (
        FactInternetSales,
        "ProductKey", CONVERT ( FactInternetSales[ProductKey], INTEGER ),
        FactInternetSales[CustomerKey],
        FactInternetSales[OrderDate]
    )
)
Key Considerations
- Performance: Assess the impact of calculated tables on overall model performance.
- Dependencies: Be mindful of dependencies between calculated tables and other model elements.
- Best Practices: Follow best practices for DAX coding and table design for optimal efficiency and maintainability.
In this article, I have demonstrated how to use 10 DAX functions that can return a table and some common use cases for each. However, several other DAX functions can be used in similar or different ways to return a table, but I haven’t demonstrated those options. For further studies, some of these DAX functions include GENERATEVAR / VAR, RELATED, EXCEPT, INTERSECT, CALCULATETABLE, ITERATE, etc.
It is important to note that this article is only the beginning of your journey. Dive deeper into each function, explore advanced techniques, and experiment with your data. Remember, the only limit is your imagination.
Next Steps
- Check out this Microsoft documentation on AdventureWorks sample databases.
- Read more about the DAX ADDCOLUMNS in this DAX guide documentation by SQL BI.
- Read more about the DAX CROSSJOIN in this Microsoft documentation.
- Read more about the DAX VALUES function in its Microsoft documentation.
- Read more about the DAX SUMMARIZE function in its Microsoft documentation.
- Read more about the DAX GENERATE function in its Microsoft documentation.
- Read more about the DAX UNION function in its Microsoft documentation.
- Read more about the DAX TOPN function in its Microsoft documentation.
- Read more about the DAX FILTER function in its Microsoft documentation.
- Read more about the DAX CALENDAR function in its Microsoft documentation.
- Read more about the DAX CALENDARAUTO function in its Microsoft documentation.
- Read more about the DAX NATURALINNERJOIN function.
- Read more about the DAX NATURALLEFTOUTERJOIN function.

Kenneth A. Omorodion is a Microsoft Certified Solutions Associate (MCSA) with 12+ years of enterprise application experience in Power BI, DAX, Microsoft Fabric, Business Intelligence, data warehousing, SSRS, T-SQL, and Azure. Beyond his technical skills, Kenneth has expertise working with stakeholders’ and business leaders to help them better understand key insights. He has a great track record of successfully delivering full life cycle Business Intelligence and data solutions to organizations with measurable business impact.
- MSSQLTips Awards
- Achiever Award (75+ Tips) – 2025
- Author of the Year-2021
- Author Contender-2022/2023/2024


Hello Community! I Am trying to use a DAX query to create a table… My query works fine in the DAX editor… but I fail to transpose it as a table DAX-definition.
Table definition is of type:
table1 = …
Any idea how to proceed ? :) Thanks & KR, Alfred
// DAX Query
DEFINE
COLUMN ‘__SQDS0VisualCalcs'[Percent of grand total] =
(/* USER DAX BEGIN */
BLANK()
/* USER DAX END */)
COLUMN ‘__SQDS0VisualCalcs'[Percent of grand total 1] =
(/* USER DAX BEGIN */
BLANK()
/* USER DAX END */)
VAR __SQDS0FilterTable =
TREATAS({“2030”}, ‘Q6_i6b_ABAT_sort'[YEAR_STREAM])
VAR __SQDS0FilterTable2 =
TREATAS({“Ghirardelli Chocolate Company”}, ‘Q6_i6b_ABAT_sort'[SITE])
VAR __SQDS0FilterTable3 =
FILTER(
KEEPFILTERS(VALUES(‘Q6_i6b_ABAT_sort'[SCOPE_SBT_GROUP_FLAG_TYPE])),
NOT(‘Q6_i6b_ABAT_sort'[SCOPE_SBT_GROUP_FLAG_TYPE] IN {“Scope ALL”})
)
VAR __ValueFilterDM2 =
FILTER(
KEEPFILTERS(
SUMMARIZECOLUMNS(
‘Q6_i6b_ABAT_sort'[Index],
‘Q6_i6b_ABAT_sort'[Action name],
__SQDS0FilterTable,
__SQDS0FilterTable2,
__SQDS0FilterTable3,
“SumSpecCost_kCHF_tCO2e”, CALCULATE(SUM(‘Q6_i6b_ABAT_sort'[SpecCost_kCHF_tCO2e])),
“SumtCO2e”, CALCULATE(SUM(‘Q6_i6b_ABAT_sort'[tCO2e])),
“meas_MAX”, ‘Q6_i6b_ABAT_sort'[meas_MAX],
“meas_COMPL”, ‘Q6_i6b_ABAT_sort'[meas_COMPL]
)
),
[SumSpecCost_kCHF_tCO2e] >= 0
)
VAR __SQDS0Core =
SUMMARIZECOLUMNS(
ROLLUPADDISSUBTOTAL(
‘Q6_i6b_ABAT_sort'[Index], “IsSQDS0GrandTotalRowTotal”,
‘Q6_i6b_ABAT_sort'[Action name], “IsDM0Total”
),
__SQDS0FilterTable,
__SQDS0FilterTable2,
__SQDS0FilterTable3,
__ValueFilterDM2,
“SumSpecCost_kCHF_tCO2e”, CALCULATE(SUM(‘Q6_i6b_ABAT_sort'[SpecCost_kCHF_tCO2e])),
“SumtCO2e”, CALCULATE(SUM(‘Q6_i6b_ABAT_sort'[tCO2e])),
“meas_MAX”, ‘Q6_i6b_ABAT_sort'[meas_MAX],
“meas_COMPL”, ‘Q6_i6b_ABAT_sort'[meas_COMPL]
)
VAR __SQDS0VisualCalcsInput =
SELECTCOLUMNS(
KEEPFILTERS(
SELECTCOLUMNS(
__SQDS0Core,
“Index”, ‘Q6_i6b_ABAT_sort'[Index],
“IsSQDS0GrandTotalRowTotal”, [IsSQDS0GrandTotalRowTotal],
“Action_name”, ‘Q6_i6b_ABAT_sort'[Action name],
“IsDM0Total”, [IsDM0Total],
“SumSpecCost_kCHF_tCO2e”, [SumSpecCost_kCHF_tCO2e],
“SumtCO2e”, [SumtCO2e],
“meas_MAX”, [meas_MAX],
“meas_COMPL”, [meas_COMPL]
)
),
“Sum of Index”, [Index],
“Action name”, [Action_name],
“IsSQDS0GrandTotalRowTotal”, [IsSQDS0GrandTotalRowTotal],
“IsDM0Total”, [IsDM0Total],
“SpecCost_kCHF_tCO2e”, [SumSpecCost_kCHF_tCO2e],
“tCO2e”, [SumtCO2e],
“meas_MAX”, [meas_MAX],
“meas_COMPL”, [meas_COMPL]
)
TABLE ‘__SQDS0VisualCalcs’ =
__SQDS0VisualCalcsInput
WITH VISUAL SHAPE
AXIS rows
GROUP [Sum of Index] TOTAL [IsSQDS0GrandTotalRowTotal]
GROUP [Action name] TOTAL [IsDM0Total]
ORDER BY
[Sum of Index] ASC,
[Action name] ASC
DENSIFY “IsDensifiedRow”
VAR __SQDS0RemoveEmptyDensified =
FILTER(
KEEPFILTERS(‘__SQDS0VisualCalcs’),
OR(
NOT(‘__SQDS0VisualCalcs'[IsDensifiedRow]),
NOT(ISBLANK(‘__SQDS0VisualCalcs'[Percent of grand total]))
)
)
VAR __DS0Core =
SELECTCOLUMNS(
KEEPFILTERS(
FILTER(
KEEPFILTERS(__SQDS0RemoveEmptyDensified),
AND(
‘__SQDS0VisualCalcs'[IsSQDS0GrandTotalRowTotal] = FALSE,
‘__SQDS0VisualCalcs'[IsDM0Total] = FALSE
)
)
),
“‘__SQDS0VisualCalcs'[Sum of Index]”, ‘__SQDS0VisualCalcs'[Sum of Index],
“‘__SQDS0VisualCalcs'[Action name]”, ‘__SQDS0VisualCalcs'[Action name],
“‘__SQDS0VisualCalcs'[SpecCost_kCHF_tCO2e]”, ‘__SQDS0VisualCalcs'[SpecCost_kCHF_tCO2e],
“‘__SQDS0VisualCalcs'[tCO2e]”, ‘__SQDS0VisualCalcs'[tCO2e],
“‘__SQDS0VisualCalcs'[Percent of grand total]”, ‘__SQDS0VisualCalcs'[Percent of grand total],
“‘__SQDS0VisualCalcs'[Percent of grand total 1]”, ‘__SQDS0VisualCalcs'[Percent of grand total 1],
“‘__SQDS0VisualCalcs'[meas_MAX]”, ‘__SQDS0VisualCalcs'[meas_MAX],
“‘__SQDS0VisualCalcs'[meas_COMPL]”, ‘__SQDS0VisualCalcs'[meas_COMPL]
)
VAR __DS0RemoveContextOnlyColumns = UNION(
SELECTCOLUMNS(
KEEPFILTERS(__DS0Core),
“Series”,”SpecCost”,
“Action name”, ‘__SQDS0VisualCalcs'[Action name],
“tCO2e”, ‘__SQDS0VisualCalcs'[tCO2e],
“SeriesVALUE”, ‘__SQDS0VisualCalcs'[SpecCost_kCHF_tCO2e]
),
SELECTCOLUMNS(
KEEPFILTERS(__DS0Core),
“Series”,”SpecCost_COMPL”,
“Action name”, ‘__SQDS0VisualCalcs'[Action name],
“tCO2e”, ‘__SQDS0VisualCalcs'[tCO2e],
“SeriesVALUE”, ‘__SQDS0VisualCalcs'[meas_COMPL]
)
)
VAR AA = TOPN(501, __DS0RemoveContextOnlyColumns, 1 )
EVALUATE
AA