Problem
Microsoft has recently announced a few important changes to the MINX and MAXX functions in the DAX language. (See Power BI September 2023 Feature Summary.) The MINX and MAXX functions now include an optional variant parameter to be more flexible and powerful.
The MINX and MAXX functions play crucial roles in Power BI data analysis. The updates to these functions not only introduce syntax changes but also make it easier to write more robust DAX code to extract valuable insights and make informed decisions based on the highest or lowest values within the datasets. In conjunction with other related DAX functions and filters, the MINX and MAXX functions can be particularly useful when performing complex and advanced calculations with large datasets.
Solution
This tip will provide basic information on the MINX and MAXX functions. It will describe the updates and syntax changes and demonstrate the various usages with the sample dataset. Along the way, we will introduce some advanced tricks to enhance the utilization of the MINX and MAXX functions and also point out some common mistakes and potential pitfalls so you can be aware and avoid them.
The Excel dataset and Power BI workbook can be downloaded here.
Sample Dataset
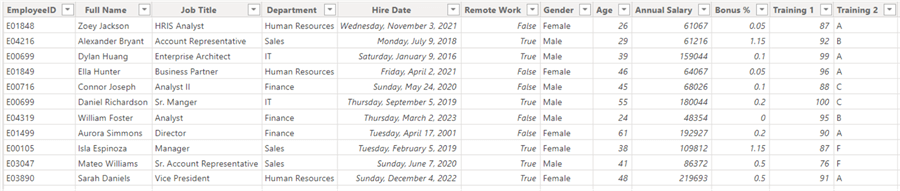
To demonstrate DAX MINX and MAXX functions, I created a small sample Employee dataset for a fictional company. The dataset has only one table (EmployeeData) showing basic information on employees such as Full Name, Job Title, Hire Date, Age, Annual Salary, YearlyReview, and Training 1 to Training 4 test results:
Next, we’ll use the dataset to demonstrate how to use the recently updated DAX MINX and MAXX functions.
The Basics of DAX MINX and MAXX Functions
The MINX and MAXX functions are designed to find the lowest and highest value from evaluating an expression for each row of a table, respectively. Let’s first look at the syntax of the MINX and MAXX functions:
Syntax
MINX(<table>, < expression>,[<variant>])

MAXX(<table>, < expression>,[<variant>])
The MINX and MAXX functions require exactly the same parameters as below:
Parameters
| Term | Definition |
|---|---|
| table | The table containing the rows for which the expression will be evaluated. |
| expression | The expression to be evaluated for each row of the table. |
| variant | (Optional) If TRUE, and if there are variant or mixed value types, the lowest (MINX) or highest (MAXX) value based on ORDER BY ASC is returned. |
Here’s an example of how to use the MINX and MAXX functions. In the sample table named EmployeeData, we have columns Full Name, Age, and Annual Salary.
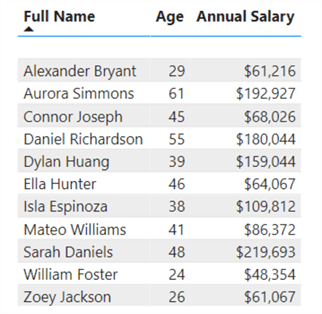
To find the lowest and highest salaries, we can use the MINX and MAXX DAX functions, with the table as the first argument, with or without the Age filter, and the Annual Salary column as the expression.
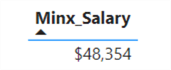
We can easily create a new measure Minx_Salary by using the MINX function as below:
Minx_Salary = MINX(EmployeeData, (EmployeeData[Annual Salary]))
The MINX function returns the following result:
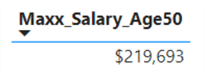
Similarly, we can use the MAXX function to find the highest salary for those employees at or under age 50 by creating another measure, Maxx_Salary_Age50, as below:
Maxx_Salary_Age50 = MAXX(FILTER(EmployeeData,[Age] <=50), (EmployeeData[Annual Salary]))
The measure gives the following result:
The Changes to DAX MINX and MAXX Functions
The September 2023 update for Power BI brought a few significant changes to the MINX and MAXX functions. The functions now include an optional variant parameter, which allows you to specify whether to include text in the calculation.
Before the change, the MINX and MAXX functions ignored text and Boolean values when there were variants or mixed data types such as text and numeric. With the change, when the optional variant parameter is NOT set, the default variant parameter value is set to FALSE. The MINX and MAXX functions would still ignore text and Boolean values, so all existing DAX expressions using MINX and MAXX will not be impacted by this change.
Let’s see some samples. I created a table named [VariantType] with two columns, [DataType] and [ColumnVariant], as seen below:
![[VariantType] table](/wp-content/images-tips/7904_power-bi-dax-functions-minx-and-maxx-5.png)
Next, we create a measure, [MeasureVariant], which returns a value of the corresponding data type according to column [DataType]:
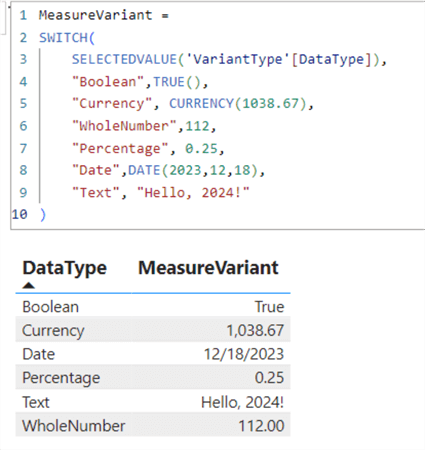
As we know, the September 2023 update for the MINX and MAXX functions added an optional variant parameter. If the variant parameter is NOT set, or the value for this parameter is set as FALSE, MINX and MAXX will ignore text and Boolean data types.
Let’s create a new measure for the variant measure, [MeasureVariant], shown above:
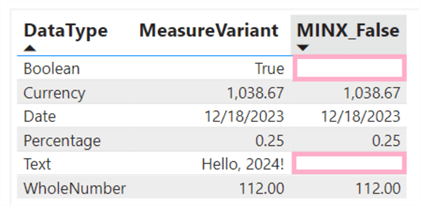
MINX_False = MINX('VariantType',[MeasureVariant],FALSE)
As the visual below illustrates, the Boolean rows and Text rows have no results returned even though they clearly have values.
When MINX and MAXX with the variant parameter are set to TRUE, they now include text values, but Boolean values are still ignored.
MINX_True = MINX('VariantType',[MeasureVariant],TRUE)
The table visual below demonstrates that the Text row now has a result:

Also, note that when MINX and MAXX include text values, the functions return the result based on the alphabetical order of the values. Let’s create two measures to list the values for column [Training 2]:
Training2_HighestScore_OfficeWork = MINX(FILTER(EmployeeData,[Remote Work] = FALSE), (EmployeeData[Training 2]))
Training2_LowestScore_RemoteWork = MAXX(FILTER(EmployeeData,[Remote Work] = True), (EmployeeData[Training 2]))
Here, we use MINX to get the score “A,” the lowest value in the column returned alphabetically. In contrast, “F” is the highest value by the alpha order returned by MAXX:

Advanced Usage of DAX MINX and MAXX Function
When dealing with data in Power BI, sometimes we need to find the highest (maximum) and lowest (minimum) values across multiple columns. We must do some hacks combing multiple DAX functions to achieve our goal, as the MAX and MIN functions in DAX don’t allow multiple columns as arguments:
MAX(<column>)

MAX(<expression1>, <expression2>)

MAX function returns the largest value in a column, or the larger value between two scalar expressions.
Same for the MIN function:
MIN(<column>)

MIN(<expression1>, <expression2>)
MIN function returns the smallest value in a column, or the smaller value between two scalar expressions.
Source - MAX & MIN
We have the following dataset showing Employee’s [Training 1], [Training 3], [Training 4], and [YearlyReview] scores:
![Employees table with [Training 1], [Training 3], [Training 4], and [YearlyReview] scores](/wp-content/images-tips/7904_power-bi-dax-functions-minx-and-maxx-10.png)
We can create a measure, [Highest_Score_Across4Columns], using the following DAX code to find the highest score across the four columns:
Highest_Score_Across4Columns =
MAXX (
    {
        MAX (EmployeeData[Training 1]),
        MAX (EmployeeData[Training 3]),
        MAX (EmployeeData[Training 4]),
        MAX (EmployeeData[YearlyReview])
    },
    [Value]
)
Here, we use the curly brackets to create a 4-row virtual table, which will return the max values for each column. The virtual table will have the default column name as Value. This column is then used as an expression in the MAXX function. MAXX iterates through the four lines of the column Value and returns the highest value found. Here, the value is 100.
Similarly, we can use DAX code combining MIN and MINX to create a measure, [Lowest_Score_Across4Columns]:
Lowest_Score_Across4Columns =
MINX (
    {
        MIN (EmployeeData[Training 1]),
        MIN (EmployeeData[Training 3]),
        MIN (EmployeeData[Training 4]),
        MIN (EmployeeData[YearlyReview])
    },
    [Value]
)
The result is 65:
![[Highest_Score_Across4Columns] and [Lowest_Score_Across4Columns]](/wp-content/images-tips/7904_power-bi-dax-functions-minx-and-maxx-11.png)
Next Steps
For more information on DAX MINX and MAXX functions, refer to the links below:
- Power BI September 2023 Feature Summary
- MAX and MIN functions in Power BI
- DAX – MAX, MAXA & MAXX Functions
- Power BI Dax Min Function [With 15 Examples]

Sean Lee has been a SQL Server Database Administrator for over 20 years. He has worked primarily with SQL Server database administration and development, data warehouse design, data analytics and data-intensive .NET application architecting and programming.
He obtained his Microsoft Certified Solutions Expert (MCSE): Data Management and Analytics in 2016.
Sean Lee is also the founder of SharpSQL.com which provides Microsoft SQL Server, Power BI and data science related training courses and resources.


