Problem
Recently, I wrote about getting started with Power BI for business intelligence, an article which introduces Power BI to newbies and those looking for some in-depth information on Power BI as a business intelligence tool. This tutorial will be concentrating on Power BI Desktop and particularly will be looking at the concepts, anatomy and uses of DAX as a formula language while working in Power BI.
This article was specifically designed to help new and less experienced Microsoft Power BI Desktop users by providing an easy and quick understanding of DAX which is the language used for data manipulation in Power BI Desktop. For those business users or Analysts that have some experience in using Microsoft Excel advanced functions and SQL syntax, you will discover that the DAX language is very similar in many respects.
The end goal is that after going through this article in detail, anyone should be able to understand the fundamentals of DAX as a formula language and how it is used in Power BI to do data analysis.
Solution
What is DAX
The acronym DAX stands for Data Analysis Expressions. It is a collection of functions, operators, and constants that can be used to evaluate and return one or more values when being used as a formula or expression. In other words, DAX in Power BI helps you to generate desired information from your data.
DAX is better described as a formula or a query language even though it sounds or can sometimes seem like any other programming language. It was first introduced by Microsoft in 2009 to be used with Power Pivot as an add-in in Microsoft Excel (2010). Nowadays, DAX is more popular as a language used in Power BI, although it is also used in SSAS (SQL Server Analysis Services) tabular too. But for the purpose of this tutorial we will to concentrate on DAX in Power BI only.
DAX can be used to create calculated columns or calculated measures in Power BI Desktop, we will be elaborating on these later in this article.
Why use DAX in Power BI
When you first start to use Power BI Desktop to create visualizations to provide insights, you might be tempted to think that it is not that important to write DAX queries, since you are able to create the visual with a simple drag and drop of the fields into the chosen charts. But if when you need to create more complex or logical visuals to shows insights from your data, then you cannot do without DAX.
For example, when you need to create a visual that shows a cumulative growth in sales overtime, or you want to compare sales in a date range to another date range, then you would certainly need the capabilities of DAX in Power BI. The ability to understand and write efficient and accurate DAX queries will ensure you are able to bring out deep insights from your data.
So, it is evident that as a Power BI user, you only need a basic knowledge of how to get data into Power BI and create visuals that generate insights out of your data. But to be more robust and become advanced in using Power BI to solve business problems, you need to understand the fundamentals of DAX.
How Data Analysis Expressions (DAX) works
As with learning any other languages, the best way to learn and understand DAX is to understand the fundamentals. DAX has other important concepts, but you would be good to understand the three fundamental concepts that form the backbone of how we use it. These fundamental concepts include:
- Syntax
- Functions
- Context
We will elaborate on each of these three important fundamental concepts in more detail next.
DAX Syntax
The Syntax of any language/formula refers to how the formula is written. It includes the various components that make up the formula. Thus, DAX syntax includes the various elements that comprise the DAX formula.
To describe this in detail, let’s look at the DAX measure as shown below by dissecting it into the various components that make up the formula.
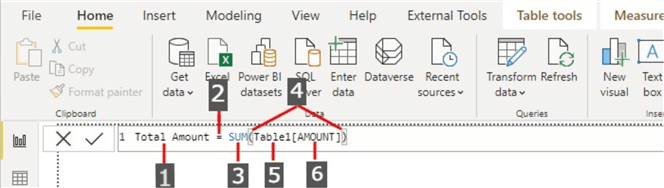
The syntax elements of the formula above have been labeled one to six with a number representing each syntax element. Let’s now describe what each syntax element represents.
- Element 1: This is showing the name we assigned to the measure (formula) we created. In this case it is “Total Amount“.
- Element 2: This is the DAX EQUALS sign operator (=) which indicates the beginning of the formula.
- Element 3: This is the DAX SUM function which serves as an aggregate that adds up all the values in the Amount column.
- Element 4: This represents the parenthesis () which encloses an expression in DAX. In DAX, most functions require at least one argument.
- Element 5: This is the table name being referenced. In this case the table name is “Table1“.
- Element 6: This is the column name being referenced in Table1 table. Since an argument passes a value to a function, the SUM function receives an aggregated value from the “Amount” column by summing every value in the column.
It is quite easier to understand a DAX formula by breaking down the various elements as described above, and to translate these into everyday language we understand. To translate the formula above into easily understood everyday language, we can re-write the formula as follows:
To create the Measure called Total Amount, we calculate (=) the SUM of values in the [AMOUNT] column in the Table1 table.
DAX Context
Of all the fundamental concepts of DAX, Context is one of the most important anyone would need to understand. In DAX, there are two types of context: row context and filter context.
Attributes of Row Context in DAX:
- The row context is easy to understand vs the filter context.
- It is most often applied to measures.
- It is most easily thought of as the current row.
- It applies whenever a formula has a function that applies filters to identify a single row in a table. Inherently, the function will apply a row context for each row of the table over which it is filtering.
Attributes of Filter Context in DAX:
- The filter context is a little bit more difficult to understand when compared to row context in DAX.
- It can easily be described as one or more filters applied in a calculation that determines a result or value.
- Usually, the filter context does not exist on its own or in place of a row context but exists alongside the row context to further narrow down the values included in a calculation.
- It is common to see filter contexts applied when functions such as CALCULATE, FILTER, ALL, RELATED is used in a calculation.
To better understand the filter context in DAX let’s take a deep look at the table and formula below and analyze its elements individually.
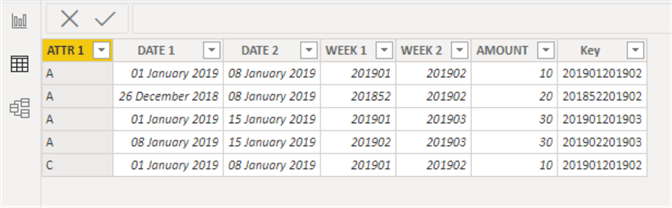
For the above table, we want to create a calculation with DAX that calculates the SUM of values in the [AMOUNT] column while applying a filter context to the [ATTR 1] column to only include where the values in [ATTR 1] column is “A” only. The formula would like the one below.
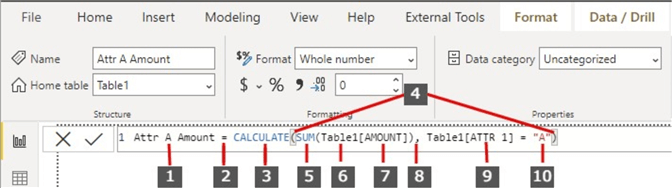
The formula above consists of the following syntax elements:
- Element 1: The name of the measure. In this case it is named “Attr A Amount“.
- Element 2: The equals sign (=) operator, indicating the beginning of the formula.
- Element 3: The CALCULATE function, which evaluates an expression, as an argument, in a context that is modified by the specified filters.
- Element 4: Parenthesis (), which surround an expression containing one or more arguments.
- Element 5: This is the DAX SUM function which serves as an aggregate that adds up all the values in the Amount column (This and Element 6 and 7 could have been combined and represented by a measure. We will discuss how to create a measure later).
- Element 6: This is the table name being referenced. In this case the table name is “Table1“.
- Element 7: This is the column name being referenced in the Table1 table.
- Element 8: This is a comma (,), which separates the first expression argument from the filter argument.
- Element 9: The fully qualified referenced column, Table1[ATTR 1]. This is our row context. Each row in this column specifies an Attribute, such as A or C as seen in the dataset table above.
- Element 10: The attribute value, “A”, as a filter. This is our filter context.
DAX Functions
DAX Functions are predefined formulas that uses specific values, known as arguments, while performing evaluations, and does this in a particular order or structure.
In general, an argument passes a value to a function, and in DAX such arguments can include other functions, another formula, expression, column references, numbers, text, logical values such as TRUE or FALSE, or constants.
Attributes of DAX Functions:
For those already familiar with Excel functions, there are lots of similarities with many of the DAX functions we are going to be looking at in this article, however there are some unique characteristics of DAX functions as listed below:
- Unlike Excel functions, DAX functions always reference a complete column or table. To reference a particular value from a column or table you need to apply a filter context as discussed earlier.
- DAX provides functions that allow calculations to be customized on a row-by-row basis.
- DAX has many functions that return a table instead of a value, and this table (although is not displayed) can be further used as an argument or input to other functions.
- DAX has a variety of functions predefined for time intelligence calculations that allow for defining or selecting of date ranges as well as performing calculations off the defined date ranges.
As we cannot write on everything relating to DAX functions in one article, you can get more information on DAX functions here.
Now, let’s understand some common categories of DAX functions and their syntax. Please note that as there is a huge number of these functions, a link is provided to the documentation so you can get more detailed information.
Date and Time DAX Functions:
For those familiar with Excel functions, you will find that there are many DAX date and time functions that are like those of Excel. The only major difference is that DAX functions make use of column values as an argument and, use a datetime datatype.
As at the time of writing this article, there are currently about 23 date and time functions in DAX. However, it is important to know that Microsoft updates this list often. These functions include:
- CALENDAR
- CALENDARAUTO
- DATE
- DATEDIFF
- DATEVALUE
- DAY
- EDATE
- EOMONTH
- HOUR
- MINUTE
- MONTH
- NOW
- QUARTER
- SECOND
- TIME
- TIMEVALUE
- TODAY
- UTCNOW
- UTCTODAY
- WEEKDAY
- WEEKNUM
- YEAR
- YEARFRAC
You can find more details on Date and Time functions in this Microsoft documentation.
Time Intelligence DAX Functions:
In DAX there are currently over 30 functions used to manipulate data using time periods such as days, months, quarters, and years. These are called Time Intelligence functions. These functions make it possible to build and compare calculations overtime. These functions include the following:
- CLOSINGBALANCEMONTH
- CLOSINGBALANCEQUARTER
- CLOSINGBALANCEYEAR
- DATEADD
- DATESBETWEEN
- DATESINPERIOD
- DATESMTD
- DATESQTD
- DATESYTD
- ENDOFMONTH
- ENDOFQUARTER
- ENDOFYEAR
- FIRSTDATE
- FIRSTNONBLANK
- LASTDATE
- LASTNONBLANK
- NEXTDAY
- NEXTMONTH
- NEXTQUARTER
- NEXTYEAR
- OPENINGBALANCEMONTH
- OPENINGBALANCEQUARTER
- OPENINGBALANCEYEAR
- PARALLELPERIOD
- PREVIOUSDAY
- PREVIOUSMONTH
- PREVIOUSQUARTER
- PREVIOUSYEAR
- SAMEPERIODLASTYEAR
- STARTOFMONTH
- STARTOFQUARTER
- STARTOFYEAR
- TOTALMTD
- TOTALQTD
- TOTALYTD
You can find more details on Time Intelligence functions in this Microsoft documentation.
DAX Information Functions:
Information functions in DAX considers a row or cell that is used as an argument to determine if the value matches the expected type. Most of the functions here return a TRUE or FALSE output. These functions include:
- CONTAINS
- CONTAINSROW
- CONTAINSSTRING
- CONTAINSSTRINGEXACT
- CUSTOMDATA
- HASONEFILTER
- HASONEVALUE
- ISBLANK
- ISCROSSFILTERED
- ISEMPTY
- ISERROR
- ISEVEN
- ISFILTERED
- ISINSCOPE
- ISLOGICAL
- ISNONTEXT
- ISNUMBER
- ISODD
- ISONORAFTER
- ISSELECTEDMEASURE
- ISSUBTOTAL
- ISTEXT
- NONVISUAL
- SELECTEDMEASURE
- SELECTEDMEASUREFORMATSTRING
- SELECTEDMEASURENAME
- USERNAME
- USEROBJECTID
- USERPRINCIPALNAME
You can find more details on Information functions in this Microsoft documentation.
DAX Logical Functions:
As the name of the functions denotes, logical functions return information about values or sets in an expression by altering the expression. For example, you can use the IF logical function to check the result of an expression and create conditional results. As at the time of writing this article, there are currently about ten logical functions in DAX, and they include the following.
- AND
- COALESCE
- FALSE
- IF
- IF.EAGER
- IFERROR
- NOT
- OR
- SWITCH
- TRUE
You can find more details on Logical functions in this Microsoft documentation.
DAX Mathematical Functions:
For those familiar with Excel mathematics and trigonometric functions, they are very similar to DAX mathematical functions as described in this section as follows.
- ABS
- ACOS
- ACOSH
- ACOT
- ACOTH
- ASIN
- ASINH
- ATAN
- ATANH
- CEILING
- COMBIN
- COMBINA
- CONVERT
- COS
- COSH
- CURRENCY
- DEGREES
- DIVIDE
- EVEN
- EXP
- FACT
- FLOOR
- GCD
- INT
- ISO.CEILING
- LCM
- LN
- LOG
- LOG10
- MROUND
- ODD
- PI
- POWER
- PRODUCT
- PRODUCTX
- QUOTIENT
- RADIANS
- RAND
- RANDBETWEEN
- ROUND
- ROUNDDOWN
- ROUNDUP
- SIGN
- SQRT
- SUM
- SUMX
- TRUNC
You can find more details on Mathematical functions in this Microsoft documentation.
DAX Statistical Functions:
DAX Statistical functions are very similar to Excel aggregations functions. In DAX, they are used to create aggregations such as COUNTS, AVERAGES, MAX, MIN etc. At the time of writing this article, the existing statistical functions in DAX include the following.
- APPROXIMATEDISTINCTCOUNT
- AVERAGE
- AVERAGEA
- AVERAGEX
- BETA.DIST
- BETA.INV
- CHISQ.DIST
- CHISQ.DIST.RT
- CHISQ.INV
- CHISQ.INV.R
- CONFIDENCE.NORM
- CONFIDENCE.T
- COT
- COTH
- COUNT
- COUNTA
- COUNTAX
- COUNTBLANK
- COUNTROWS
- COUNTX
- DATATABLE
- DISTINCTCOUNT
- DISTINCTCOUNTNOBLANK
- EXPON.DIST
- GEOMEAN
- GEOMEANX
- MAX
- MAXA
- MAXX
- MEDIAN
- MEDIANX
- MIN
- MINA
- MINX
- NORM.DIST
- NORM.INV
- NORM.S.DIST
- NORM.S.INV
- PERCENTILE.EXC
- PERCENTILE.INC
- PERCENTILEX.EXC
- PERCENTILEX.INC
- POISSON.DIST
- RANK.EQ
- RANKX
- SAMPLE
- SIN
- SINH
- STDEV.P
- STDEV.S
- STDEVX.P
- STDEVX.S
- SQRTPI
- T.DIST
- T.DIST.2T
- T.DIST.RT
- T.INV
- T.INV.2t
- TAN
- TANH
- VAR.P
- VAR.S
- VARX.P
- VARX.S
You can find more details on Statistical functions in this Microsoft documentation.
DAX Text Functions:
Based on the library of Excel string functions, Power BI has DAX text functions that has been modified to work with tables and columns in tabular models. At the time of writing this article, there are currently about 21 text functions in DAX, and these include the following.
- COMBINEVALUES
- CONCATENATE
- CONCATENATEX
- EXACT
- FIND
- FIXED
- FORMAT
- LEFT
- LEN
- LOWER
- MID
- REPLACE
- REPT
- RIGHT
- SEARCH
- SUBSTITUTE
- TRIM
- UNICHAR
- UNICODE
- UPPER
- VALUE
You can find more details on Text functions in this Microsoft documentation.
DAX Parent and Child Functions:
Currently, DAX presents about five functions to help manage data that is presented as a parent-child hierarchy.
These functions allow a user to obtain the entire lineage of parents a row has, the number of levels in the lineage compared to the top parent, determine the parent n-levels above the current row, outlines the n-descendant from the top of the current row hierarchy and whether certain parent are parent in the current row hierarchy. The functions are as follows.
- PATH
- PATHCONTAINS
- PATHITEM
- PATHITEMREVERSE
- PATHLENGTH
You can find more details on Parent and Child functions in this Microsoft documentation.
Other:
Besides the categories of functions already described in this article, DAX has some other unique functions that perform unique actions that cannot be defined by any of the other categories of functions. These functions are as follows.
- BLANK
- ERROR
You can find more details on these Other functions in this Microsoft documentation.
Calculation (Expressions) Types in DAX
When creating calculations in DAX, you can do so in two ways: Calculated Column or Calculated Measure. The choice of calculation type depends on what solutions a user wants to achieve at a particular time. We will now describe each of the calculation types in DAX individually in some detail.
DAX Calculated Columns
A calculated column is an extension of a table in a Power BI data model by creating additional columns, whose context is defined by a DAX expression which is evaluated on a row-by-row basis or in the context of the current row in the table.
It is expected that newbies and less experienced Power BI analysts might sometimes wonder when to create a calculated column or a calculated measure. The best way to clarify this is to ask yourself this question: are you trying to create a calculation that would be evaluated on a row level in the table you are working with? The question means are you trying to create a calculation that you can see what is in each row within the table you are working on.
Other reasons to consider creating a calculated column instead of a calculated measure may include:
- If you want to use the calculated results in a slicer, or want to see results in rows or columns in a pivot table (as opposed to the values area), or in the axes of a chart, or use the result as a filter condition in a DAX query.
- If you want to define an expression that is strictly bound to the current row. For example, UnitPrice * OrderQuantity cannot work on an average or on a sum of the two columns.
- If you want to categorize text or numbers. For example, a range of values for a measure.
To illustrate this, let’s say we have the table below in the Power BI data model. This is a Sales table and we are trying to know how much profit we made per product sold. You would agree with me that you would like to see the profits for each product or customer row by row on a column. You would not want to aggregate (create a measure) the value for profit as it cannot be represented row by row on the table.

So, to create the Profit calculated column we need write a DAX calculated column expression in the format as shown below:
Profit = Revenue – Total Cost
First, we need to create a calculation for Revenue as we don’t have it in the table readily. We can see the table above has a UnitPrice column already and an OrderQuantity column, thus we can use these two to calculate Revenue as seen below:
Revenue = UnitPrice * OrderQuantity
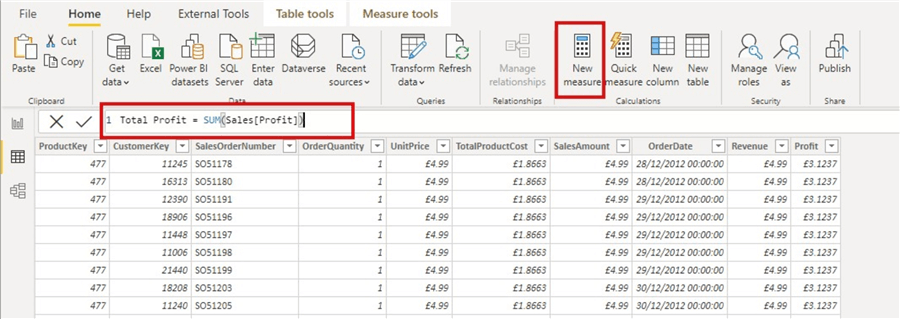
The DAX calculation is as seen below. As can be seen, the formula is written in the formula bar at the top and the column is created on the extreme right of the table.
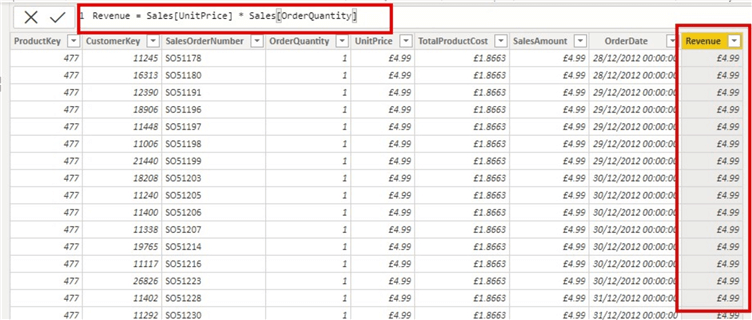
Now that we have Revenue created for each ProductKey row representing each product bought on a specific date, we can then calculate the Profit made on each product sold each date using the Profit formula mentioned earlier. See the diagram below to illustrate this.

As we can now see from the diagram above, we can now tell what profit was made per each product on a row by row basis. This is a typical reason or situation where a calculated column is what is required other than a calculated measure in this case.
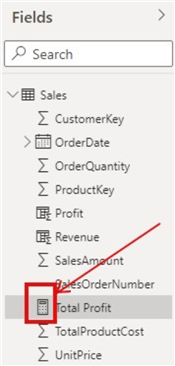
The newly created calculated column should have a symbol at the front of the Fields pane as seen in the diagram below.

DAX Calculated Measures
Calculated measures on the other hand are aggregated values created from a DAX expression. They are better described as dynamic calculation formulas where the results change depending on context. Unlike the calculated columns, measure DAX expressions are not evaluated on a row-by-row basis or in the context of the current row in the table. Although, measures are defined in a particular table, but they do not actually belong to any table since measures can be moved from one table to another without losing its functionality.
Since measures utilize aggregations of data defined by the current context, this in turn depends on the filter applied in the report. Such filters may include slicers, rows, and columns selection in a pivot table, or axis and filters applied to a chart.
To determine when to define a measure calculation instead of a calculated column, consider if you want to display the resulting calculation values that reflect user selections in your Power BI solution. For example, looking at the table above, let’s say we need to be able to select a date range and determine the profit for that date range. The best option is to create a calculated measure showing an aggregate of the Profit column. Thus, whenever a date range is selected, the measure visual should reflect the value of Profit based on the selection or filter applied.
Other reasons to consider creating a calculated measure instead of a calculated column may include:
- If you want to create an aggregated calculation on a certain selection of data.
- If for example you need to calculate ratios of a product compared to all products but keeping the filter both by year (OrderDate) and Customer (CustomerKey).
Let’s now illustrate how the aggregated measure calculation of the Profit column can be done. This is the same way as we would create a calculated column, but now we are creating it as a measure instead as shown below.
The newly created measure should have a calculator-like symbol at the front of the Fields pane as seen in the diagram below.
In summary, we learnt about the basic concepts of DAX as a formula/query language. By now, I am sure you can be relatively confident on writing basic DAX for solving your Power BI problems and, if you ever want to learn more, there are thousands of resources out there on the internet to guide you through. I have also provided further links below which you can explore to further your knowledge on DAX in Power BI.
Next Steps
- For more information on Microsoft Documentation on DAX reference please see here.
- You can get more information on Parent and Child functions here.
- Checkout this Microsoft documentation on an Overview of DAX here.
- Get some more information on DAX Syntax here.
- Try this tip out in your own data as business requires.

Kenneth A. Omorodion is a Microsoft Certified Solutions Associate (MCSA) with 12+ years of enterprise application experience in Power BI, DAX, Microsoft Fabric, Business Intelligence, data warehousing, SSRS, T-SQL, and Azure. Beyond his technical skills, Kenneth has expertise working with stakeholders’ and business leaders to help them better understand key insights. He has a great track record of successfully delivering full life cycle Business Intelligence and data solutions to organizations with measurable business impact.
- MSSQLTips Awards
- Achiever Award (75+ Tips) – 2025
- Author of the Year-2021
- Author Contender-2022/2023/2024


Hi Johnier, nice to hear this article is of help to you. Thanks!
Excellent article, of great help.
Congratulations.