Problem
Since information can come from a lot of different data sources (both structured and unstructured), you need a solution to be able to gather and visualize data then share your findings among your team in a clear-concise way.
In Part 1 we discussed how to install and configure Power BI, also discussed how to create a basic dashboard and data connectivity modes. In Part 2 we covered Power Query, and how you can perform simple ETL processes within Power BI. In this tip we will learn how to publish and refresh our reports.
Solution
We learn how to use Power BI desktop, the application that allow us to create and edit the reports, but once we have them ready to use, we need a repository to publish and secure our reports. Microsoft provides two main options to host your .pbix reports: you can use an on-premises Power BI Report Server (out of scope on this tip), and the most commonly used Power BI Service that we will discuss in this tip.
What is the Power BI Service?
Is a collaborative platform that Microsoft provides to create, maintain and secure our reports and datasets via customizable dashboards, also you can package your dashboards via apps and make them available on the Power BI app source.
It can be accessed accessing app.powerbi.com and it requires a subscription to use it.
There are three subscription tiers so far:
- Power BI desktop – Free: once you create a Power BI account via Power BI desktop, you can use basic publish features for personal use.
- Power BI Pro – $9.99/ Month – Fully managed Power BI service, it offers more collaborative options.
- Power BI Premium – $4,995/Month – It offers all features and provides dedicated cloud computing and storage resources.
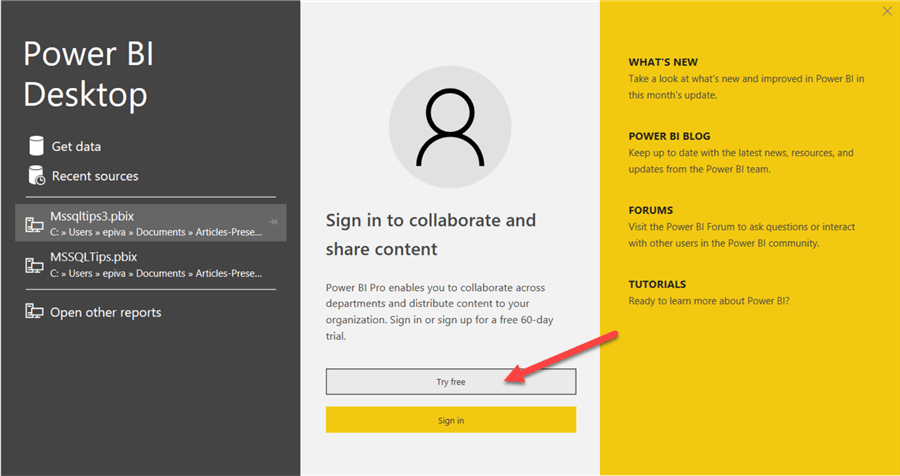
For this tip, we will use the free version. For creating a free account, you can use the Power BI Desktop welcome screen, and click on Try Free:
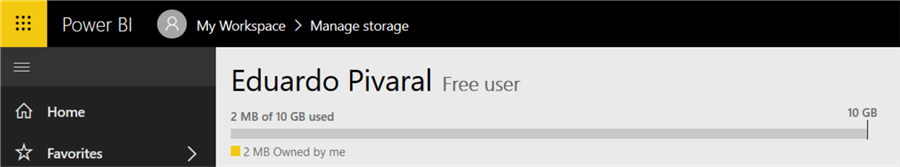
Once you have created an account and accessing the site app.powerbi.com, the main page looks like this:
We will now see the most basic option, publish reports.
Publishing Reports to Power BI Service
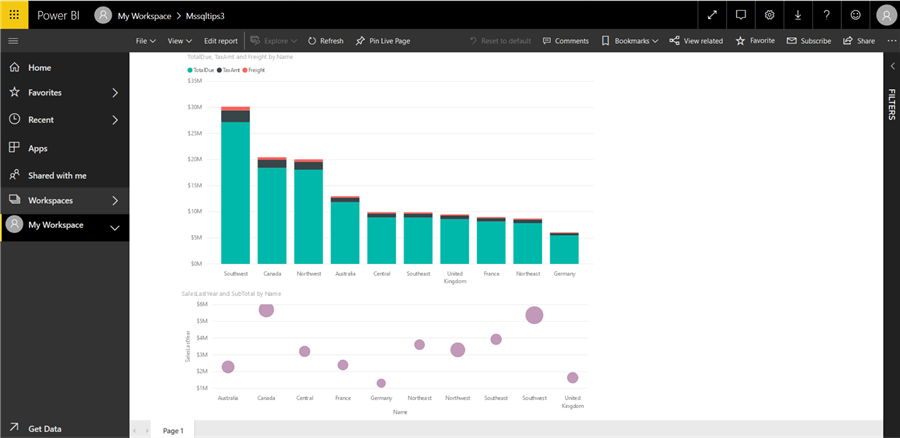
Once you have your report configured and ready to use, publishing it is very simple, let us take this sample report using AdventureWorks2017 test database:
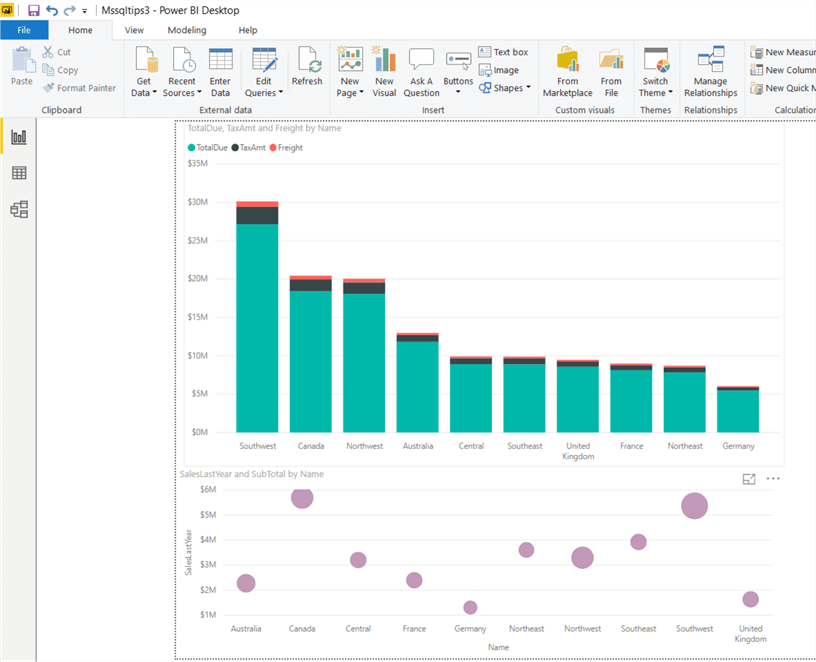
Nothing complicated, just 2 charts for illustrative purposes.
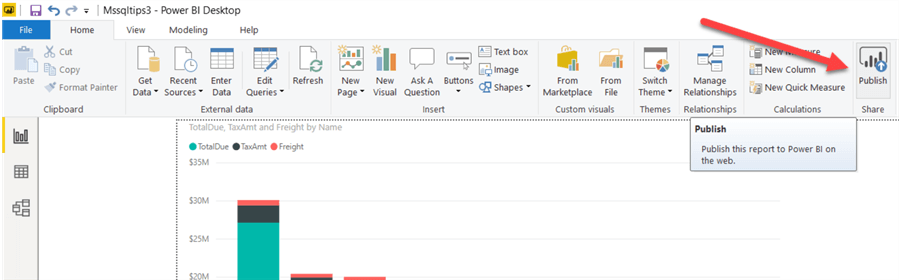
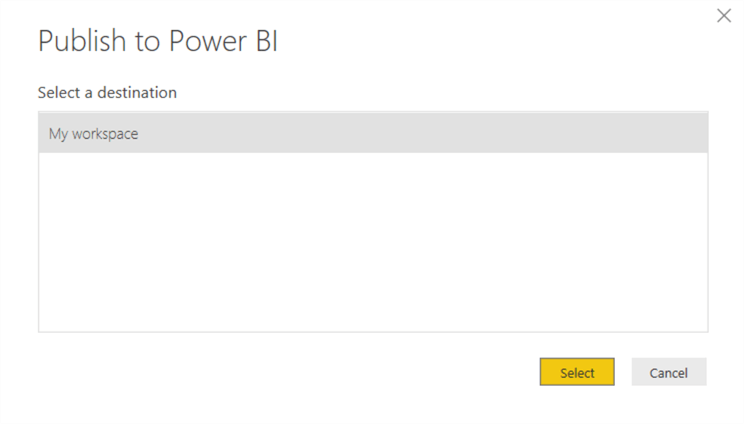
To publish it to your Power BI service, just click the Publish button on the Home tab:
If you are logged in, the workspace destination will be asked, for now, select the default workspace (we will see how to create more later):
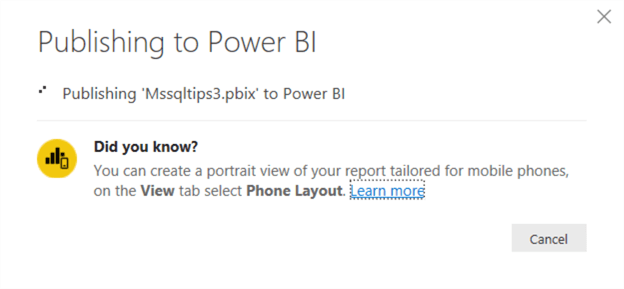
It will start the publishing process, and it will take some time depending on your report size:
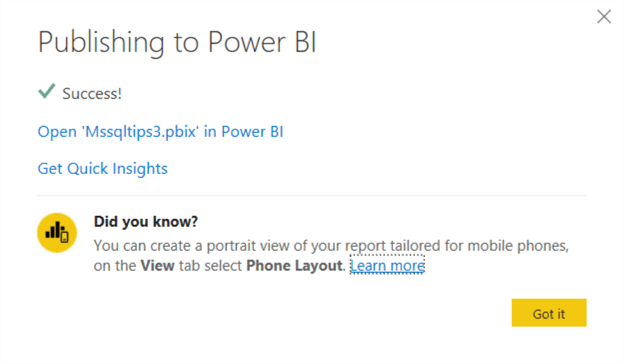
Once completed, the wizard will provide you the option to visualize it online:
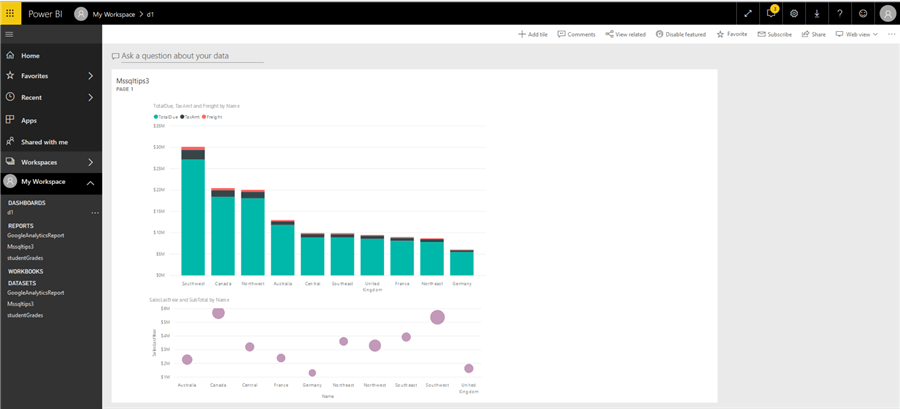
If you open the report, you can now visualize it online:
Ok, that is the basic-static publishing operation, let us see some more options.
Configuring Data Gateway
The idea of using Power BI is to have updated data for your reports to be used, but until now, the data load (unless you are using DirectQuery) is done manually.
Power BI service provides us a tool to connect your on-premises sources with the cloud service, allowing you to refresh your data sources without worrying about security or access issues.
The tool is called Data Gateway, which is installed on a machine with internet connectivity, that hs access to your Data Source and will act as a bridge between the source and the cloud service.
To install the tool, download it from your Power BI Service homepage, clicking on Downloads > Data Gateway:
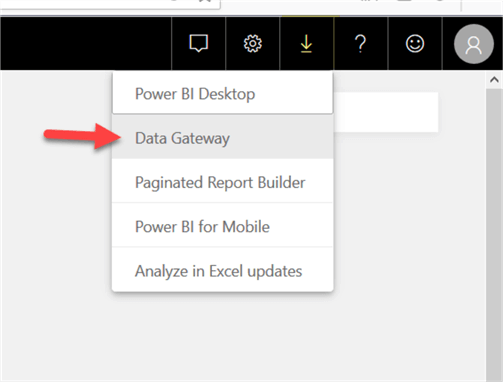
This will open a new window where you can download the installer.
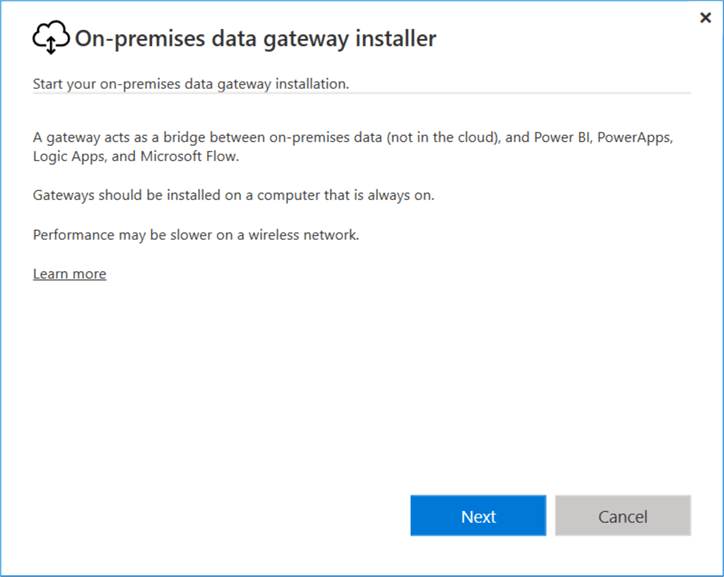
Once downloaded, run it on a machine that can be always online, with access to internet (or at least the power BI service) and with access to the data sources you plan to use.
The first page of the installer will show you the recommendations we have discussed so far, click on Next.
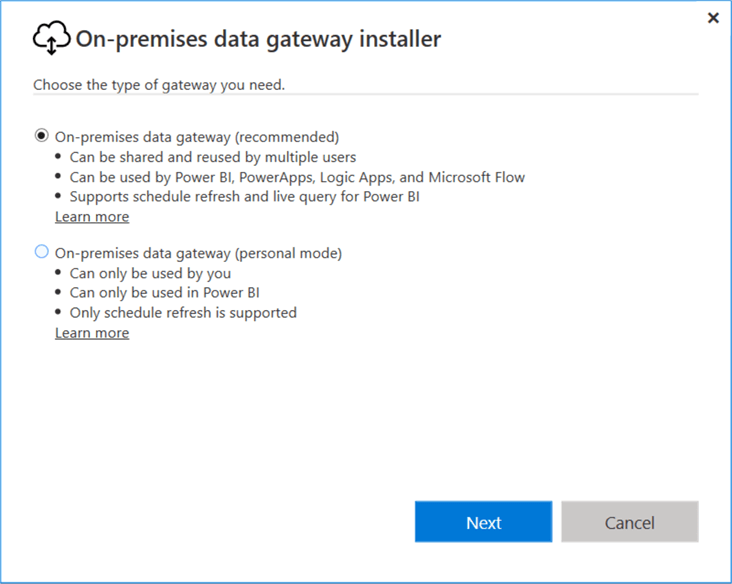
There are two types of gateway you can use:
- On-premises: Can be used for multiple users and support all features. This is the recommended type to use.
- Personal only: Can be used for the user that installs it, and only support data refresh, ideal if you are using only your personal machine and perform the refresh on-demand or a less frequent schedule.
For this tip we will use the on-premises type.
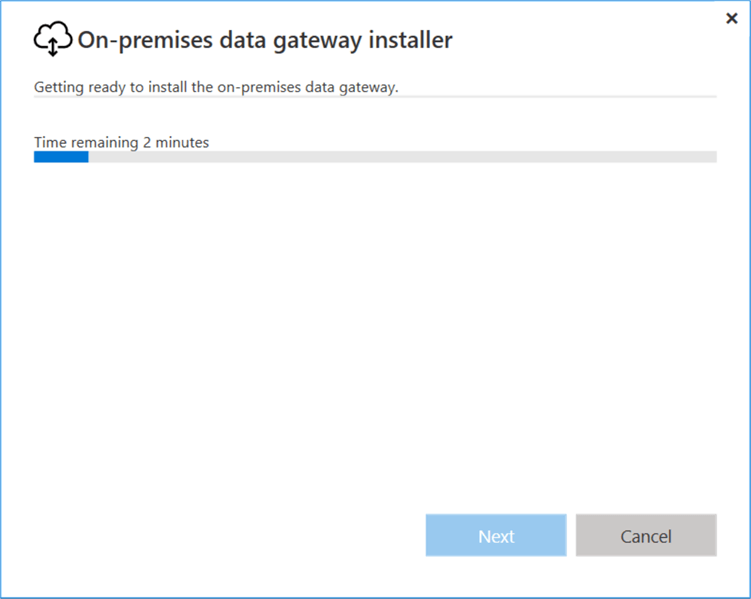
Wait for the installer to finish downloading all the required packages based on your choice:
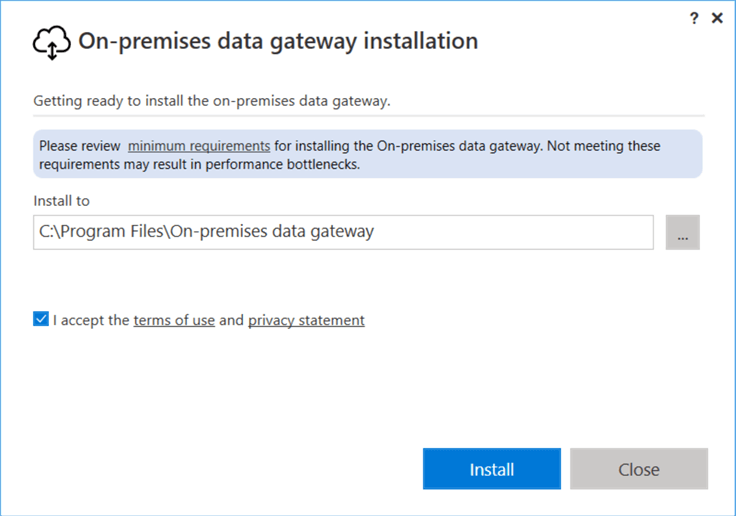
Select the path where you want to install the gateway, accept the terms and click on the Install button:
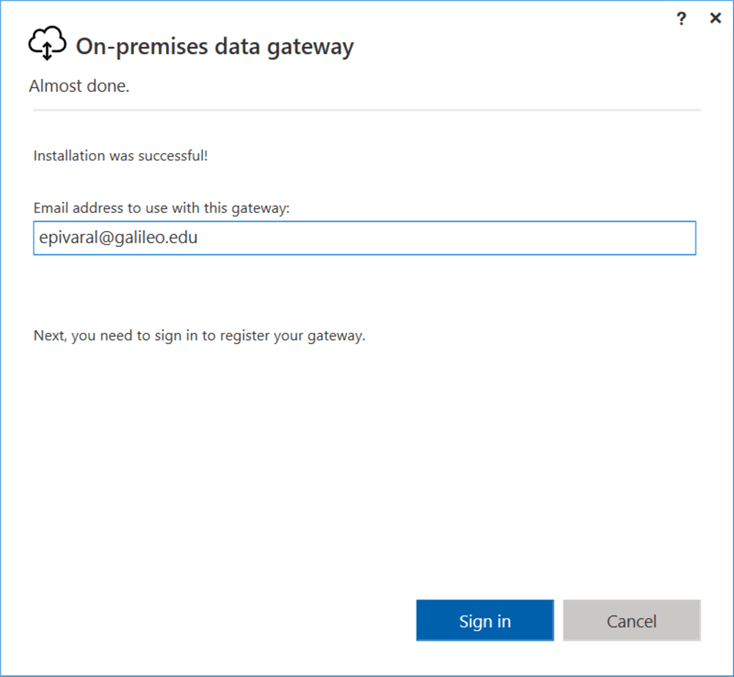
Once the setup is finished, sign in to the Power BI service with your credentials, this will start the gateway:
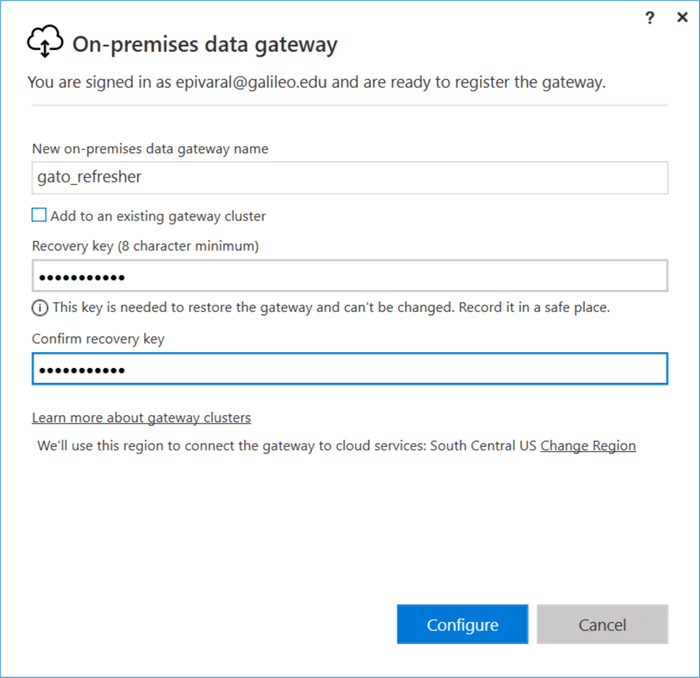
Once you are signed in, you can create a new gateway (by entering a name and a recovery key) or use an existing one, enter the required data and click on the Configure button.
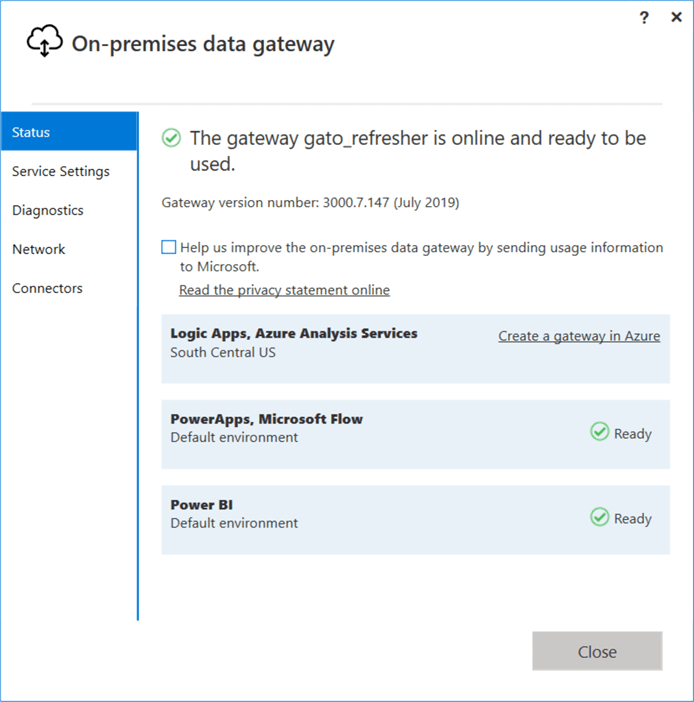
Once the gateway is configured, the gateway console will open (you can close it if you want now) and if you open the program again, you will see the service status:
Once the gateway is up and running, we can configure our report dataset to connect to the gateway.
Configuring and Refreshing your Dataset
Once the gateway has been created and is running on the machine, access your Power BI Service, go to Settings > Manage Gateways.
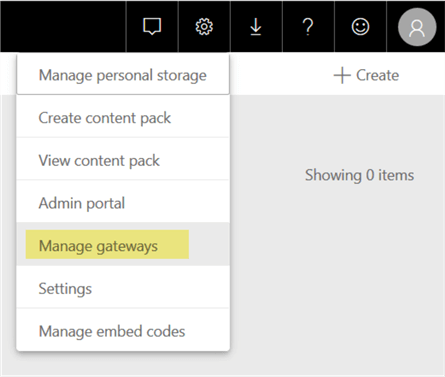
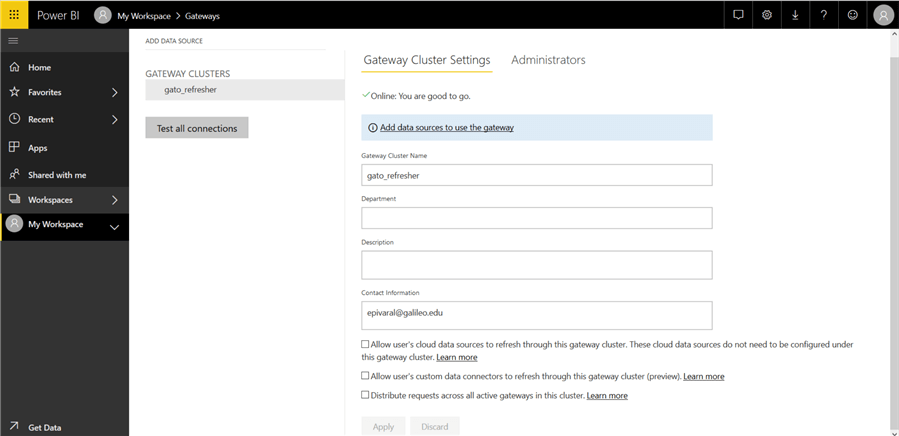
In this section, you can administer your gateways, and assign new administrators to it, by default, the account that configured the gateway is added as an administrator.
To add a dataset, click on Add data sources to use the gateway:
A new window will open, provide a meaningful name, and select the data source type and the connection details (for this example SQL Server), and once done, click on the Add button:
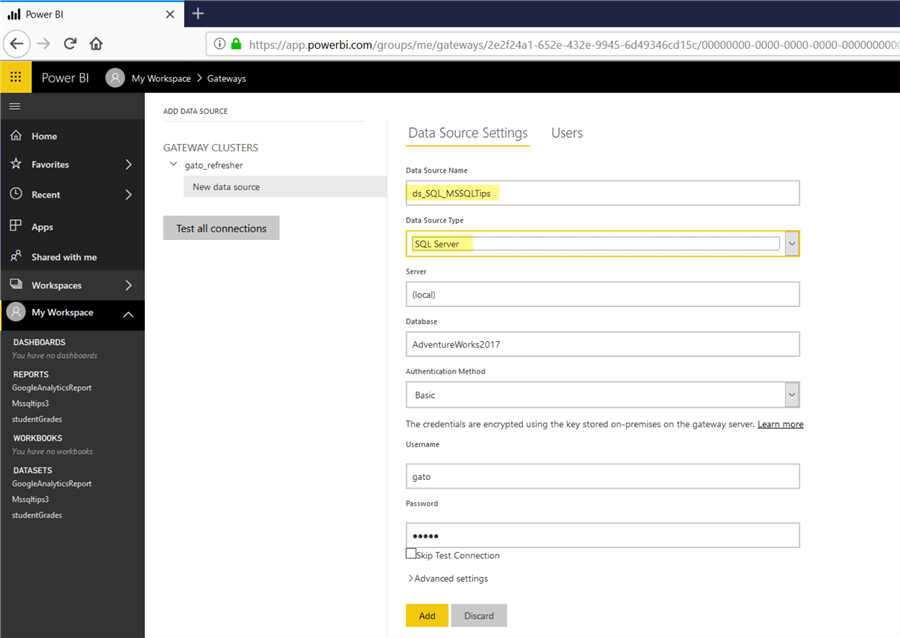
Please note that for Server name we use (local), this is because Power BI service connects to the gateway agent installed on the machine, and from there, the connection to the specific resource is made.
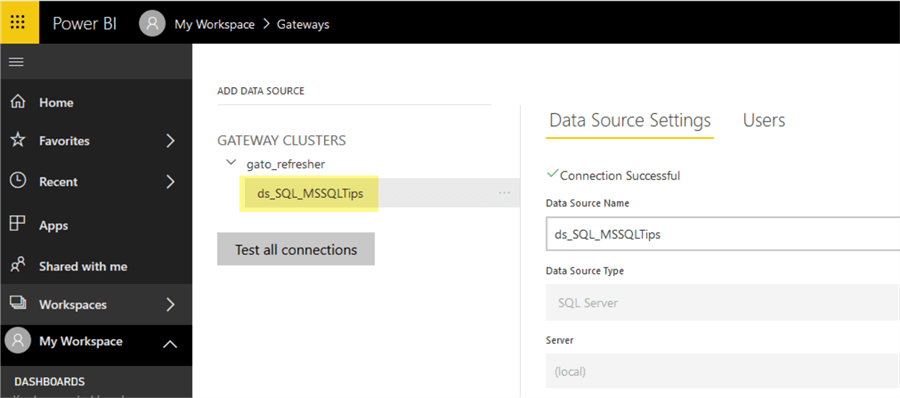
Once created we can see that the data source is now listed under the gateway:
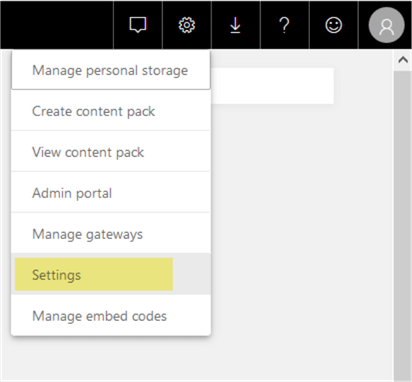
Once the data source is created, we need to bind it to the report we just uploaded, for this, go to Settings:
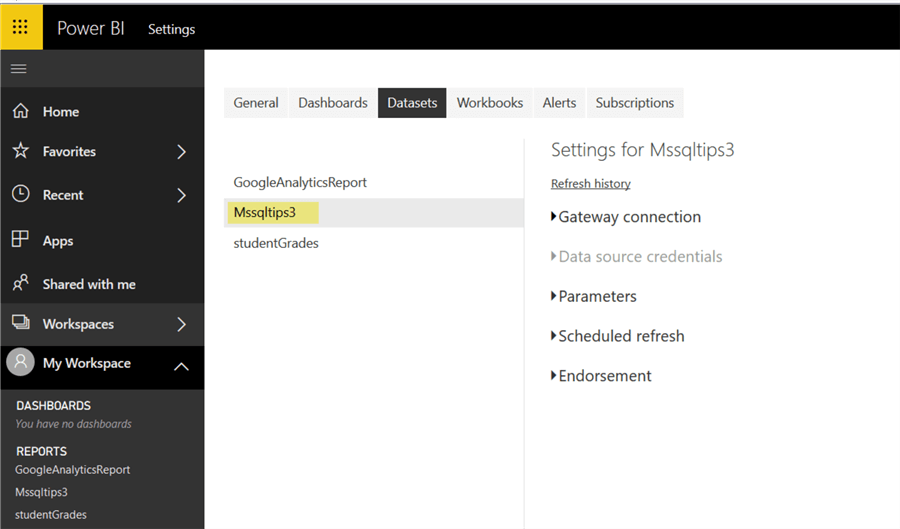
In the new window, Select Datasets, and then select the dataset you want to configure:
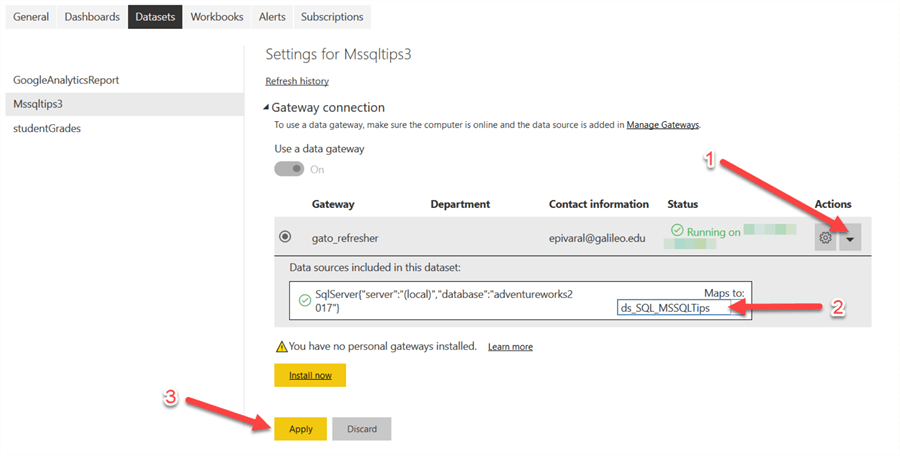
Click Gateway connection, then click on the triangle at the right under Actions.
In there, select to which dataset you want to map the data source, and after that click on Apply:
If everything is ok, after clicking apply, we will have the ability to refresh our report data.
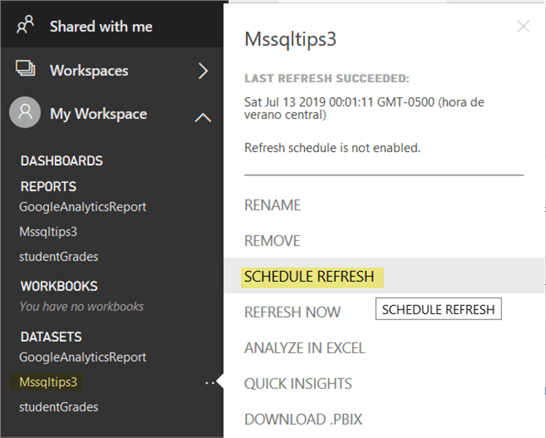
To test that everything is ok we will perform a manual refresh. To do it, in the left menu, click on Datasets, select the dataset you just configured and click on Refresh Now:
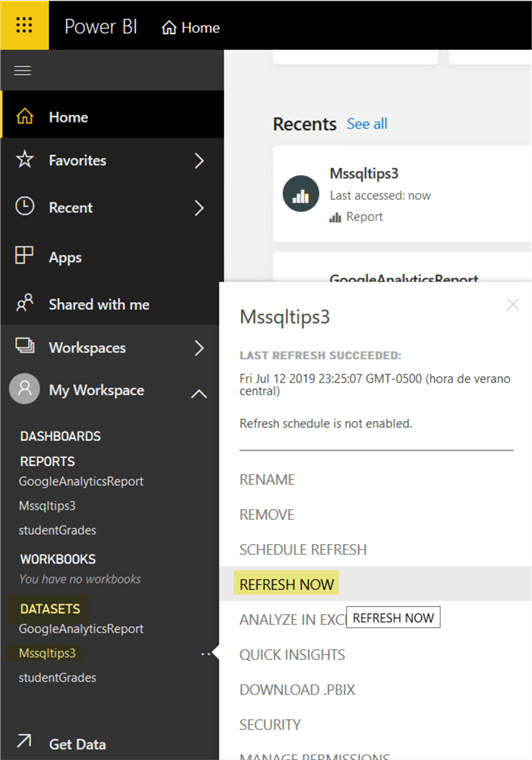
Depending on your dataset size this can take some time to complete, but if everything is ok, you will see the last refresh succeeded date changing.
Now that everything is working fine, you can proceed to schedule an automatic refresh of your dataset (if you have used the Import option, for DirectQuery, a refresh is not needed), so now click on Schedule Refresh:
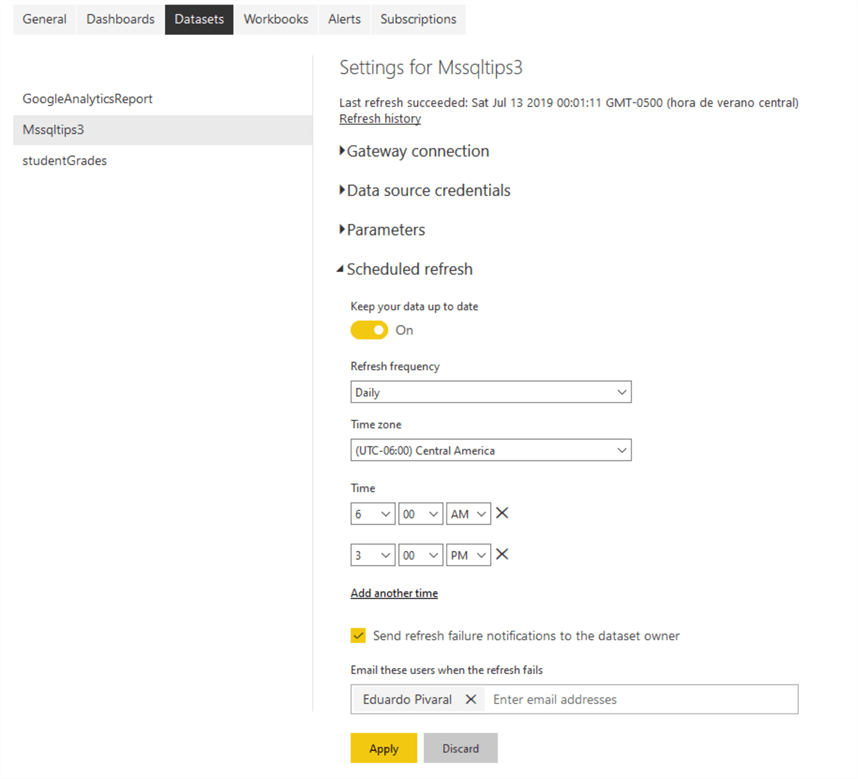
In the new window, specify how often you want to refresh your data. Note that the smallest time interval is half an hour, if you want a more frequent refresh, you should consider using DirectQuery.
Once you are ok with the refresh schedule you configured, click on Apply:
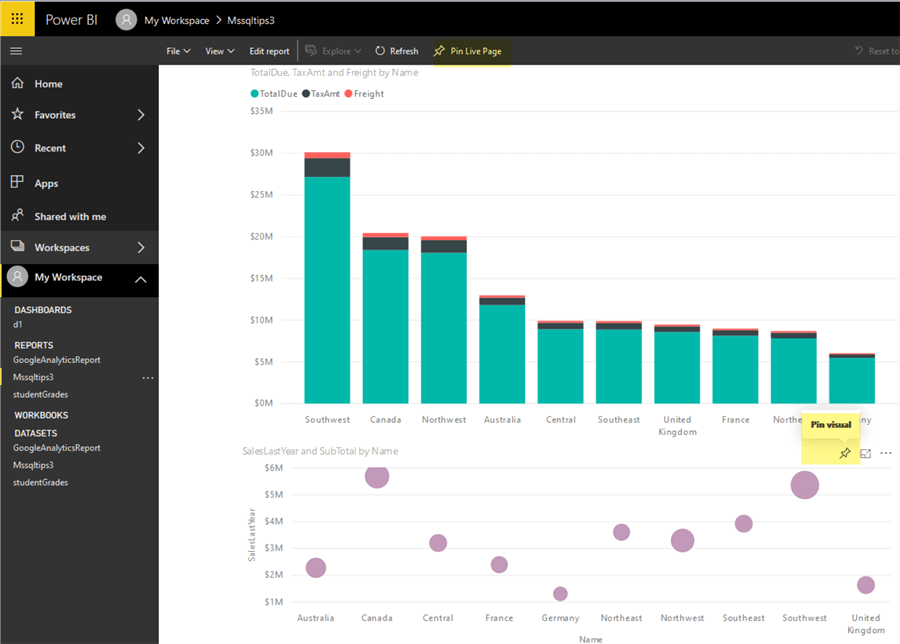
Now you can pin your report to a dashboard, just keep in mind that a dashboard is a collaborative tool and is part of a Power BI Pro subscription.
To pin to a dashboard, just open the report, and you can pin the whole report or just a part of it, by clicking on the Pin Live Page icon:
A new window will appear where you can select to add to an existing dashboard or create a new one, then click on Pin Live button:
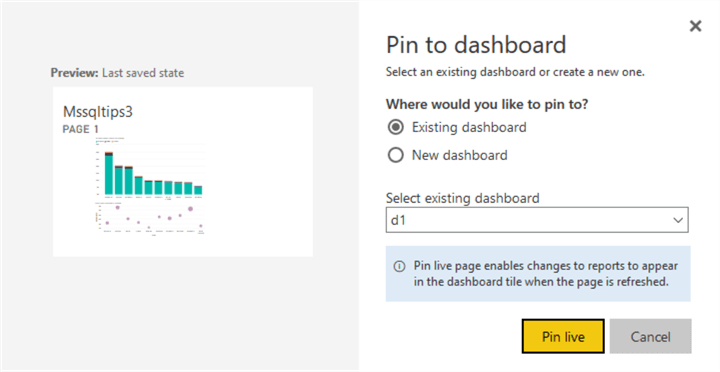
After that you have your first report configured as a collaborative dashboard up and running:
Next Steps
- Check out Part 1 where we discuss how to create a report.
- Check out Part 2 to learn about Power BI ETL capabilities.
- Power BI desktop can be downloaded from here.
- You can see all Power BI tips here.

Eduardo Pivaral is an MCSA, SQL Server Database Administrator and Developer with over 15 years of experience working in large environments.
- MSSQLTips Awards: Trendsetter (25+ tips) – 2020 | Author of the Year Contender – 2019 | Rookie of the Year – 2018


