Problem
Since information can come from a lot of different data sources (both structured and unstructured), you need a solution to be able to gather and visualize data, and have the ability to share your findings among your team in a clear-concise way. In Part 1 of this tip series, we discussed how to install and configure Power BI and also discussed how to create a basic dashboard and data connectivity modes. In this tip, we will discuss Power Query and how you can perform simple ETL processes within Power BI.
Solution
Continuing with Part 1, we will discuss ETL (Extract, Transform, Load) capabilities built into Power BI which comes with a powerful tool called Power Query. We will also perform some basic examples for data manipulation to see how it works.
Power Query is a tool that provides you the ability to transform and manage your data inside Power BI. According to Microsoft documentation, it is based on the M Language and is optimized for building flexible data mash up queries. It’s a functional, case sensitive language with a short learning curve. You can learn more about the M Language here and here.
Accessing Power Query in Power BI
To access Power Query, from Power BI desktop, click on the Home tab and then Edit Queries:

It will display a new window where you can perform some basic tasks using the GUI or some more advanced ones using M Language.

Let’s take a look at some of the options and where they can be found.
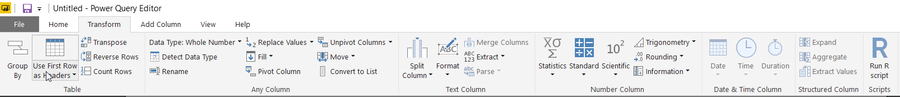
Home Tab
Basic options like column add/remove, data filtering, duplicate removal, change column data type, value replacement, joins and merges.

Transform Tab
Some more advanced options: Transpose columns, pivot/unpivot data, term extraction, data format, functions (mathematical, statistical, aggregations), normalize/denormalize data, R scripts.
Now we are ready to perform an example with real data to see how it works.
Performing basic data transforming tasks with Power Query
For this example, I have created a new dashboard and imported some tables from the WideWorldImporters SQL Server database (you can use data from multiple sources if you want), as you can see in the image below:

We will now perform some transform tasks over those tables.
Removing columns
We will make our dashboard smaller by removing columns we don’t use, so for this example we will remove [UserPreferences], [CustomFields] and [OtherLanguages] columns from Application People table.
We select the columns we want to remove, and once selected, we click on Remove Columns from the home tab.
We can see on the right pane, under Applied Steps that our action has been recorded.

Split column
In this example we will split [PhoneNumber] into [Area Code] and [PhoneNumber].
First, select the column you want to split and then click Split Column > By Delimiter on the Home tab, then we select space as a delimiter and perform the split at the left side.
Just note one thing, the area code was automatically created as a numeric column (and since the area code was in parenthesis, it now has a negative sign). This can be fixed by just removing the last step on the right side pane, so just click on the X next to the last action as follows:

And now you should be able to look the original area code.

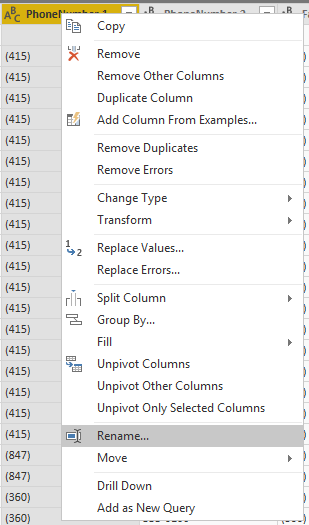
Last thing left is to just change the column name, for this just right click on the column header and select the "Rename" option, we will name it [AreaCode].
What if we want to remove the parenthesis from the newly created [AreaCode] column? We will see how to do this below.
Replace values
We will now remove the parenthesis from the [AreaCode] column.
Right click on the column and select Replace Values (or go to Transform > Replace Values) and on the new window, put the value you want to find and the replacement value (note that this option is Data Type sensitive).
We have to repeat it 2 times in order to remove both parenthesis characters, but data is properly separated now.
Note that there is another approach to perform this activity via the extract option (for character values), we will see this in the next example.
Extract values
For text columns you can also extract information to a new column, for this example we will use the [EmailAddress] column, and from it we will extract the domain name (text after @) to a new column.
Select the Add Column tab, then click on Extract > Text After Delimiter.
A new window will open, select the @ character as a delimiter, and click OK. The new column must be created at the end.

Please note that we have an Applied Steps window at the right side, where you can check what transformations we have done so far.

In here you can: Rename steps, remove (rollback) steps, change step order, change properties (for example change the character to replace). Just note that these transformation steps are at table level, you have to navigate to the table if you want to see transformations for that object.
These are some basic transformations that can be done via Power Query GUI, but maybe you are wondering “You told us before that you can program transformations via M language, where is the code?” well, all of the transformations we have done so far generated M code automatically. If you are familiar and feel comfortable with coding M language, you can perform more advanced transformations via commands, we will show how next.
Performing advanced tasks via M code
As mentioned, all the transformations we have done so far generated code automatically. To view the code, click on the View tab > Advanced Editor.

A new window will open where you can see the code for all steps applied so far, note the code is at the table (object) level.

We will see some other data transformation examples using M.
Calculated Column Using M
In this example we will use Sales CustomerTransactions table and we will calculate the tax percent from the fields below.
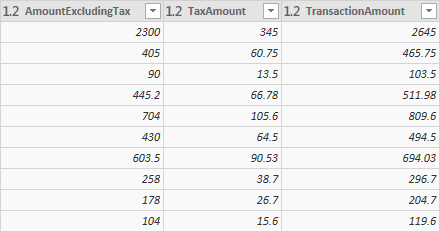
The value will be the same for all rows and the tax will be a fixed 15% rate.
We will open the advanced editor and we can see the commands for the information load.
let
  Source = Sql.Databases("(local)\sql2017"),
  WideWorldImporters = Source{[Name="WideWorldImporters"]}[Data],
  Sales_CustomerTransactions = WideWorldImporters{[Schema="Sales",Item="CustomerTransactions"]}[Data]
in
Sales_CustomerTransactions
We will add the following line and replace the in for the new step #”Inserted Percent Of”, as follows:
let
  Source = Sql.Databases("(local)\sql2017"),
  WideWorldImporters = Source{[Name="WideWorldImporters"]}[Data],
  Sales_CustomerTransactions = WideWorldImporters{[Schema="Sales",Item="CustomerTransactions"]}[Data],
  #"Inserted Percent Of" = Table.AddColumn(Sales_CustomerTransactions, "PercentOf", each [TaxAmount] / [AmountExcludingTax] * 100, type number)
in
#"Inserted Percent Of"
Your code window should look like this (remember that language is case sensitive).

Click Done to close the window and apply the transformation, you should be able to see the new column at the end.

You can find a complete Reference for the M language here.
When you are happy with your transformations, click the Close and Apply button on the Home tab. This will apply all the transformations to your data and will return you to the dashboard page.

The changes will be applied, this can take some time depending on the volume of your data and the complexity of your transformations.

If an error occurs with your calculations, it will be displayed in that window. If everything is ok, you are ready to work with your dashboard, as we explained in Part 1.
Next Steps
- Review Getting Started with Power BI Part 1 here.
- The complete reference for the M language can be found here and here.
- Power BI desktop can be downloaded from here.
- You can see all Power BI tips here.

Eduardo Pivaral is an MCSA, SQL Server Database Administrator and Developer with over 15 years of experience working in large environments.
- MSSQLTips Awards: Trendsetter (25+ tips) – 2020 | Author of the Year Contender – 2019 | Rookie of the Year – 2018