Problem
Even skilled software engineers can struggle to see all query activity after code changes. They might track a single query, but what about a stored procedure with multiple statements, or an app that calls multiple stored procedures and ORM queries via an API? Without proper tracking, it can be hard to tell what is actually running and what has changed after a code update. How can you capture and review performance activity without a complex tool like Extended Events?
Solution
SQL Server’s Query Store tracks query performance and lets you view this data through dashboard reports or built-in views. I prefer the views because they let you filter out noise with a WHERE clause. In this article, you’ll learn how to set up Query Store in a development environment to capture the query activity generated by your application changes and start reviewing the data it collects through its built-in views.
Setting Up Query Store
Microsoft introduced Query Store in SQL Server 2016, and for new databases, it has been enabled by default starting with SQL Server 2022. Query Store is often called a database flight recorder because it can track all query activity. I say “can” because with the default setting, it is selective about what it records. However, there is a setting to change the default capture mode. Everything that follows assumes you are performing all configurations and executing commands in a local development environment.
Review Default Settings
For this demo, I’m using SQL Server 2025 Developer Enterprise Edition. There really isn’t much to getting Query Store up and running. The code below does the trick. Remember, it’s enabled by default.
/* MSSQLTips.com */
USE master;
GO

IF DB_ID(N'QueryStoreDemo') IS NOT NULL
BEGIN
    ALTER DATABASE QueryStoreDemo SET SINGLE_USER WITH ROLLBACK IMMEDIATE;
    DROP DATABASE QueryStoreDemo;
END;
GO

CREATE DATABASE QueryStoreDemo;
GO

ALTER DATABASE QueryStoreDemo SET RECOVERY SIMPLE;
GO

USE QueryStoreDemo;
GO
Now, let’s check the default Query Store setting.
/* MSSQLTips.com */
SELECT
    actual_state_desc,
    query_capture_mode_desc,
    flush_interval_seconds,
    interval_length_minutes
FROM
    sys.database_query_store_options;
GO
The current capture mode is set to AUTO, which means Query Store focuses on capturing relevant queries based on execution count and resource consumption rather than capturing everything. If you use Query Store and don’t see it capturing your queries, that might be one area to investigate. With new versions of SQL Server, you can configure a custom capture mode and define thresholds.
Change Capture Mode
Since this is a development environment, I am going to set capture mode to ALL, which, as the name implies, captures everything. Given the overhead, I wouldn’t recommend this setting in a production environment. Keep in mind that capture mode remains set to ALL until you change it again.
I’ll run the code below to make the update and verify the setting again.
/* MSSQLTips.com */
ALTER DATABASE QueryStoreDemo SET QUERY_STORE (QUERY_CAPTURE_MODE = ALL);
GO

SELECT
    actual_state_desc,
    query_capture_mode_desc,
    flush_interval_seconds,
    interval_length_minutes
FROM
    sys.database_query_store_options;
GO
Let’s go ahead and create one table and insert one million rows. Notice that I’m using the WITH (TABLOCK) hint to help minimize log growth during the load (thank you, Jeff Moden, for the reminder).
/* MSSQLTips.com */
CREATE TABLE dbo.Table1
(
    Table1ID    int            NOT NULL IDENTITY(1, 1),
    Status      varchar(20)    NOT NULL,
    Amount      decimal(10, 2) NOT NULL,
    CreatedDate datetime2      NOT NULL,
    CONSTRAINT PK_Table1
        PRIMARY KEY (Table1ID)
);
GO

INSERT INTO dbo.Table1 WITH (TABLOCK)
(
    Status,
    Amount,
    CreatedDate
)
SELECT
    CASE value % 4
        WHEN 0 THEN 'Open'
        WHEN 1 THEN 'Closed'
        WHEN 2 THEN 'In Progress'
        ELSE 'Canceled' END                                         AS Status,
    CAST(ABS(CHECKSUM(NEWID())) % 100000 / 100.0 AS decimal(10, 2)) AS Amount,
    DATEADD(DAY, value % 3650, '2015-01-01')                        AS CreatedDate
FROM
    GENERATE_SERIES(1, 1000000);
GO
Now, let’s create a stored procedure that performs three tasks: first, queries data, then inserts rows, and finally updates rows.
/* MSSQLTips.com */
USE QueryStoreDemo;
GO

CREATE OR ALTER PROCEDURE dbo.usp_ProcessTable1 @Status varchar(20)
AS
BEGIN
    SET NOCOUNT ON;
    BEGIN TRY
        BEGIN TRANSACTION;
        SELECT
            COUNT(*)         AS RecordCount,
            SUM(Amount)      AS TotalAmount,
            AVG(Amount)      AS AvgAmount,
            MIN(CreatedDate) AS EarliestDate,
            MAX(CreatedDate) AS LatestDate
        FROM
            dbo.Table1
        WHERE   Status = @Status;
        INSERT INTO dbo.Table1
        (
            Status,
            Amount,
            CreatedDate
        )
        VALUES
        (@Status, 100.00, SYSDATETIME());
        UPDATE  dbo.Table1 SET  Amount = Amount * 1.05 WHERE Status = @Status;
        COMMIT TRANSACTION;
    END TRY
    BEGIN CATCH
        IF @@TRANCOUNT > 0
            ROLLBACK TRANSACTION;
        THROW;
    END CATCH;
END;
GO
Before we run a simulated workload, I want to clear out my Query Store data. I’ll mention it again here, but please don’t run this command in a production environment.
/* MSSQLTips.com */
ALTER DATABASE QueryStoreDemo SET QUERY_STORE CLEAR;
GO
Generate Query Activity
In the real world, I would use SQLQueryStress or Ostress to run the statement below; however, to keep things simple, I’ll use a WHILE loop and iterate over the procedure 50 times, passing in one of the four statuses as a parameter.
/* MSSQLTips.com */
DECLARE @Counter int = 1;
DECLARE @Status varchar(20);

WHILE @Counter <= 50
BEGIN
    SET @Status = CASE ABS(CHECKSUM(NEWID())) % 4
                      WHEN 0 THEN 'Open'
                      WHEN 1 THEN 'Closed'
                      WHEN 2 THEN 'In Progress'
                      ELSE 'Canceled' END;
    EXEC dbo.usp_ProcessTable1 @Status = @Status;
    SET @Counter += 1;
END;
GO
Review Query Store Results
Since we ran a workload, it’s time to review our results. We could use the built-in reports, such as Top Resource Consuming or Regressed Queries, but I prefer Query Store views because they offer greater flexibility with T-SQL. That said, the reports are useful for first-time demonstrations.
The statement below draws from most of the major Query Store views, including:
- sys.query_store_query_text, which stores the text for each captured query.
- sys.query_store_query, which references the previously mentioned view and contains much of the query compilation statistics.
- sys.query_store_plan, which stores one row for each execution plan associated with a query.
- sys.query_store_runtime_stats, which stores the runtime performance stats for a plan.
- sys.query_store_runtime_stats_interval, which stores the time bucket for runtime stats. This view provides a start_time and end_time for each interval.
For a comprehensive list of columns and extra views, see the Microsoft article “Query Store catalog views.”
Time Metrics
For time metrics like avg_cpu_time, I’m dividing by 1,000 to convert microseconds to milliseconds, which is easier for me to read. I use the SUM() function because Query Store stores stats over multiple intervals, and we need to combine them into a weighted average.
WHERE Clause
I’ll mention it again, but one of the primary reasons I use views rather than reports is the ability to add a handy WHERE clause. Notice that I filter out most system text, keeping only stored-procedure activity from the past 24 hours. You could exclude more patterns, but focusing on stored procedures gives the results I want for this demo.
/* MSSQLTips.com */
DECLARE @runDateandTime datetime2 = SYSUTCDATETIME();
SELECT
    @runDateandTime                                      AS RunDateandTime,
    q.query_id                                           AS QueryId,
    p.plan_id                                            AS PlanId,
    COUNT(p.plan_id) OVER (PARTITION BY q.query_id)      AS PlansPerQuery,
    CAST('<![CDATA[' + qt.query_sql_text + ']]>' AS xml) AS QueryText,
    CASE
        WHEN p.query_plan LIKE N'%MissingIndexes%' THEN 1
        ELSE 0 END                                       AS MissingIndex,
    CASE
        WHEN p.query_plan LIKE N'%Parallel="1"%' THEN 1
        ELSE 0 END                                       AS ParallelPlan,
    SUM(rs.count_executions)                             AS ExecutionCount,
    TRY_CONVERT(xml, p.query_plan)                       AS PlanXml,
    CONVERT(
        decimal(12, 2),
        SUM(rs.avg_duration * rs.count_executions)
        / NULLIF(SUM(rs.count_executions), 0) / 1000.0)  AS AvgElapsedTime_ms,
    CONVERT(
        decimal(12, 2),
        SUM(rs.avg_cpu_time * rs.count_executions)
        / NULLIF(SUM(rs.count_executions), 0) / 1000.0)  AS AvgCPUTime_ms,
    CONVERT(
        decimal(12, 2),
        SUM(rs.avg_logical_io_reads * rs.count_executions)
        / NULLIF(SUM(rs.count_executions), 0))           AS AvgLogicalReads,
    MIN(rs.last_execution_time)                          AS FirstExecution,
    MAX(rs.last_execution_time)                          AS LastExecution,
    SYSUTCDATETIME()                                     AS CreatedDateTime
FROM
    sys.query_store_plan                              AS p
    INNER JOIN sys.query_store_query                  AS q
        ON q.query_id = p.query_id
    INNER JOIN sys.query_store_query_text             AS qt
        ON qt.query_text_id = q.query_text_id
    INNER JOIN sys.query_store_runtime_stats          AS rs
        ON rs.plan_id = p.plan_id
    INNER JOIN sys.query_store_runtime_stats_interval AS rsi
        ON rsi.runtime_stats_interval_id = rs.runtime_stats_interval_id
WHERE   rs.execution_type = 0
        AND OBJECTPROPERTY(q.object_id, 'IsProcedure') = 1
        AND qt.query_sql_text NOT LIKE N'%query_store%'
        AND qt.query_sql_text NOT LIKE N'%sys.dm_%'
        AND qt.query_sql_text NOT LIKE N'%sys.objects%'
        AND qt.query_sql_text NOT LIKE N'%SELECT StatMan%'
        AND qt.query_sql_text NOT LIKE N'(@[_]msparam%'
        AND rsi.start_time >= DATEADD(DAY, -1, GETUTCDATE())
GROUP BY q.query_id,
         p.plan_id,
         p.query_plan,
         q.query_hash,
         qt.query_sql_text
ORDER BY ExecutionCount DESC;
GO
After running the query above, you should see results similar to the ones below. In this run, Query Store captures three queries, and each has one query plan. You can see there are missing index recommendations on two of them.

Let’s open the plan for the UPDATE statement (QueryId 4 in my results) by clicking on the PlanXml.
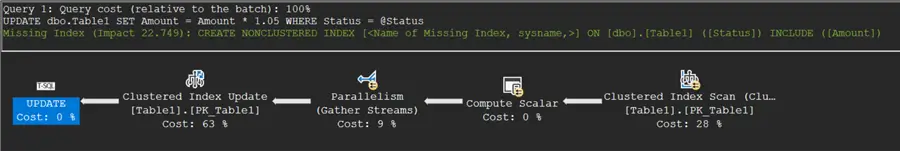
From the plan, it looks like adding an index on the Status column and including the Amount might improve performance, since our UPDATE includes a predicate on it. With that said, it would likely slow down our INSERT, but that may be a price worth paying.
Making Changes and Tracking Improvements
After capturing the Query Store data, I typically save the results to a local development table and use the SYSUTCDATETIME() function for each run to compare results after making changes, such as adding an index. Then I clear the Query Store data and rerun the load. The key is to find what works for you.
Keep in mind that changes to the query text can result in a new QueryId. That is one reason I prefer wrapping multiple statements in a stored procedure when possible. Even without a stored procedure, though, Query Store will capture the work performed during the session.
Clean Up
Once you are done with this demo, don’t forget to delete the database.
/* MSSQLTips.com */
USE [master];
GO

IF DB_ID('QueryStoreDemo') IS NOT NULL
BEGIN
    ALTER DATABASE QueryStoreDemo SET SINGLE_USER WITH ROLLBACK IMMEDIATE;
    DROP DATABASE QueryStoreDemo;
END;
GO
Conclusion
Query Store is an excellent tool for capturing query metrics when building or modifying existing code. It’s easy to enable the ALL capture mode, and with the query I provided above, you can focus on the query activity and performance details most relevant to you. There are several additional columns you can add to the query, so don’t limit yourself to only what I provided. That said, I do not intend to discount the place for tools like Extended Events in situations where more advanced tracing is needed. However, if you want an easier way to track query activity, especially in a development environment, I would start with Query Store.
Key Points
- Starting with SQL Server 2022, Query Store is enabled by default, and you can enable a custom capture mode. You usually only need View Database State access to start exploring it, but some Query Store views also require server-level state permissions.
- Changes to the query text can generate a new QueryId, which is one reason using a stored procedure can be helpful for tracking.
- Using the Query Store views with a WHERE clause makes it easy to filter out noise and focus on the queries you want to investigate.
Next Steps
- Would you like a more detailed overview of SqlQueryStress? If so, read my article, “Tune SQL Server Stored Procedures and Indexes with SqlQueryStress,” to get started.
- Are you running an older version of SQL Server Developer Edition and would like to upgrade? Check out Jim Evans’s article, “Upgrade to SQL Server 2025 Enterprise Developer Edition”.
- Edwin Sarmiento wrote the informative article, “Identify CPU Intensive SQL Queries with SQL Server Query Store.” Check it out to continue your Query Store journey.

Jared Westover is a SQL Server specialist with two decades of industry experience covering T-SQL development, performance tuning, administration and Microsoft Fabric. He is currently a software architect at Crowe, an author at Pluralsight and primary contributor at sqlhabits.com. On MSSQLTips.com, Jared is a respected award-winning author for his clever T-SQL solutions and bringing to light new real-world solutions to age-old development problems.
- MSSQLTips Awards
- Achiever Award (75+ tips) – 2026
- Author of the Year – 2023
- Author Contender – 2024/2025
